Ladies and gentlemen,
"Housing is always needed"
But who lives where, and how, is determined by social, economic and ecological factors and transformation processes. We are ageing, but the urban population is getting younger. We are living closer together, but ever more individually. We need cities that are resilient, well-connected and fair. Megatrends like these are the cause and an essential element of the transformation of entire regions and cities, and understanding them lays the foundation for sustainable and future-proof investments.
Focus No. 42, titled "Measuring the Residential Markets" is devoted to this task. In the spirit of Humboldt and Gauss, who understood how to capture and depict the physical world in its entirety, we have analyzed and mapped key megatrends for the residential markets. These maps can be used to derive findings for the development of the residential markets, from broad regions to specific micro-locations.
We hope that this edition of Focus captures your interest, and we wish you an informative and enjoyable read!


The complexity of surveying the housing and real estate markets is reminiscent of the pioneering work of Alexander von Humboldt and Carl Friedrich Gauss. Humboldt revolutionised the geographical surveying of the world with his interdisciplinary approach, while Gauss laid the foundations of modern cartography with mathematical precision. Both understood how to measure and depict the physical world in its entirety.
In a similar vein, mapping residential markets aims to identify and systematically interpret the larger context. This approach makes it possible to predict future developments based on sound knowledge, to plan investments sustainably and to meet the challenges of a changing world. The focus of the survey is on megatrends, whose dynamics unfold in the medium to long term in a cross-sectional way; in some cases across all social, technological and economic sectors. Megatrends are the cause and essential element of the transformation of entire regions and cities. This is what makes them so significant in multiple respects – including for the property industry.
These six megatrends provide a basis for classifying the diverse trend dynamics around housing. Many of these trends can be substantiated with hard facts, i.e. with quantitative, empirical indicators: using official statistics such as market and industry data, via regular surveys (e.g. census), and, increasingly, on the basis of sensor and mobile phone data, through to big data analyses.

"Two thirds of everything can be explained by demographics" — David Foot
This often-quoted phrase by economist David Foot also applies to the demand for housing, which is largely determined by demographic trends and the spatial distribution of the population.
Despite immigration, the EU population is likely to decline by around 4.2 percent in total by 2070 (prediction by the Federal Statistical Office of Germany, 2024). However, the trends in the individual countries vary greatly. While some regions are shrinking, others have been growing on a continuous basis for years. More and more people are being drawn to cities in particular, where increasing demand is exceeding the housing supply, meaning that the areas surrounding prospering cities are also becoming increasingly important.
Over the past 10 years, regions in the European Union member states have undergone very different demographic developments. Shrinking and growing regions are often located immediately next to each other. Across Europe, population growth is primarily concentrated in metropolitan and coastal regions. In Eastern Europe and the Baltic states, population growth is focused almost exclusively in major cities and their surrounding areas. The situation is quite different in Ireland, Sweden, Denmark and the Benelux countries, where the population numbers are increasing nationwide. In Spain, Portugal and France, the coast, in particular, is booming, while in Italy, only Rome and the north are growing. In Germany, in particular, the high immigration figures triggered by the Syrian war in 2015 and the Ukraine war in 2022 have had a noticeable impact on demographic trends. Germany continues to demonstrate a strong east-west divide, although here too, the large metropolitan regions are experiencing the strongest population growth.
According to many forecasts, the high-growth regions of recent years can also expect population gains in the future, leading to an increasing demand for housing, especially in metropolitan regions.
Map description: The map shows the average annual development of population numbers over the past 10 years at NUTS 3 level in Europe (corresponds to district level in Germany). The relevant data for each region can be displayed by hovering over a region with your mouse.
How large would a fictional city need to be to accommodate the entire world population?
If the entire global population lived in a city with the density of Paris (20,000 inhabitants per km²), it would be the size of Sweden. Even the less densely populated outskirts of Paris, such as the Seine-Saint-Denis department (9,200 inhabitants per km²), would require an area equivalent to that of Sweden and Finland combined.
In Barcelona, the difference is much more pronounced: the city itself is densely populated (17,300 inhabitants per km²), while the surrounding province has just 500 inhabitants per km². A city with this density that housed the entire global population would be 1.2 times larger than all European countries combined.
The situation is similar in many major European cities, such as Vienna, Copenhagen, Amsterdam, Frankfurt or Munich, whose metropolitan regions are often characterised by urban sprawl. The area surrounding Berlin is especially sparsely populated: a global city with the population density of the Dahme-Spreewald district would be 7.6 times the size of Europe.
The urbanization trend continues in Europe's big cities. This also means that the pressure on the residential markets in major cities will persist, creating corresponding investment opportunities. Against the backdrop of increasingly scarce land and the target of “net zero” land consumption by 2050, conversion areas, high-rise construction and densification of existing stands are becoming more of a focus in urban planning and the real estate industry.
Map description: The blue shading corresponds to the approximate area that a hypothetical global city with the specified population density would occupy. For some suburban regions where the hypothetical global city would exceed the size of Europe (including European Russia), the corresponding factor is indicated.


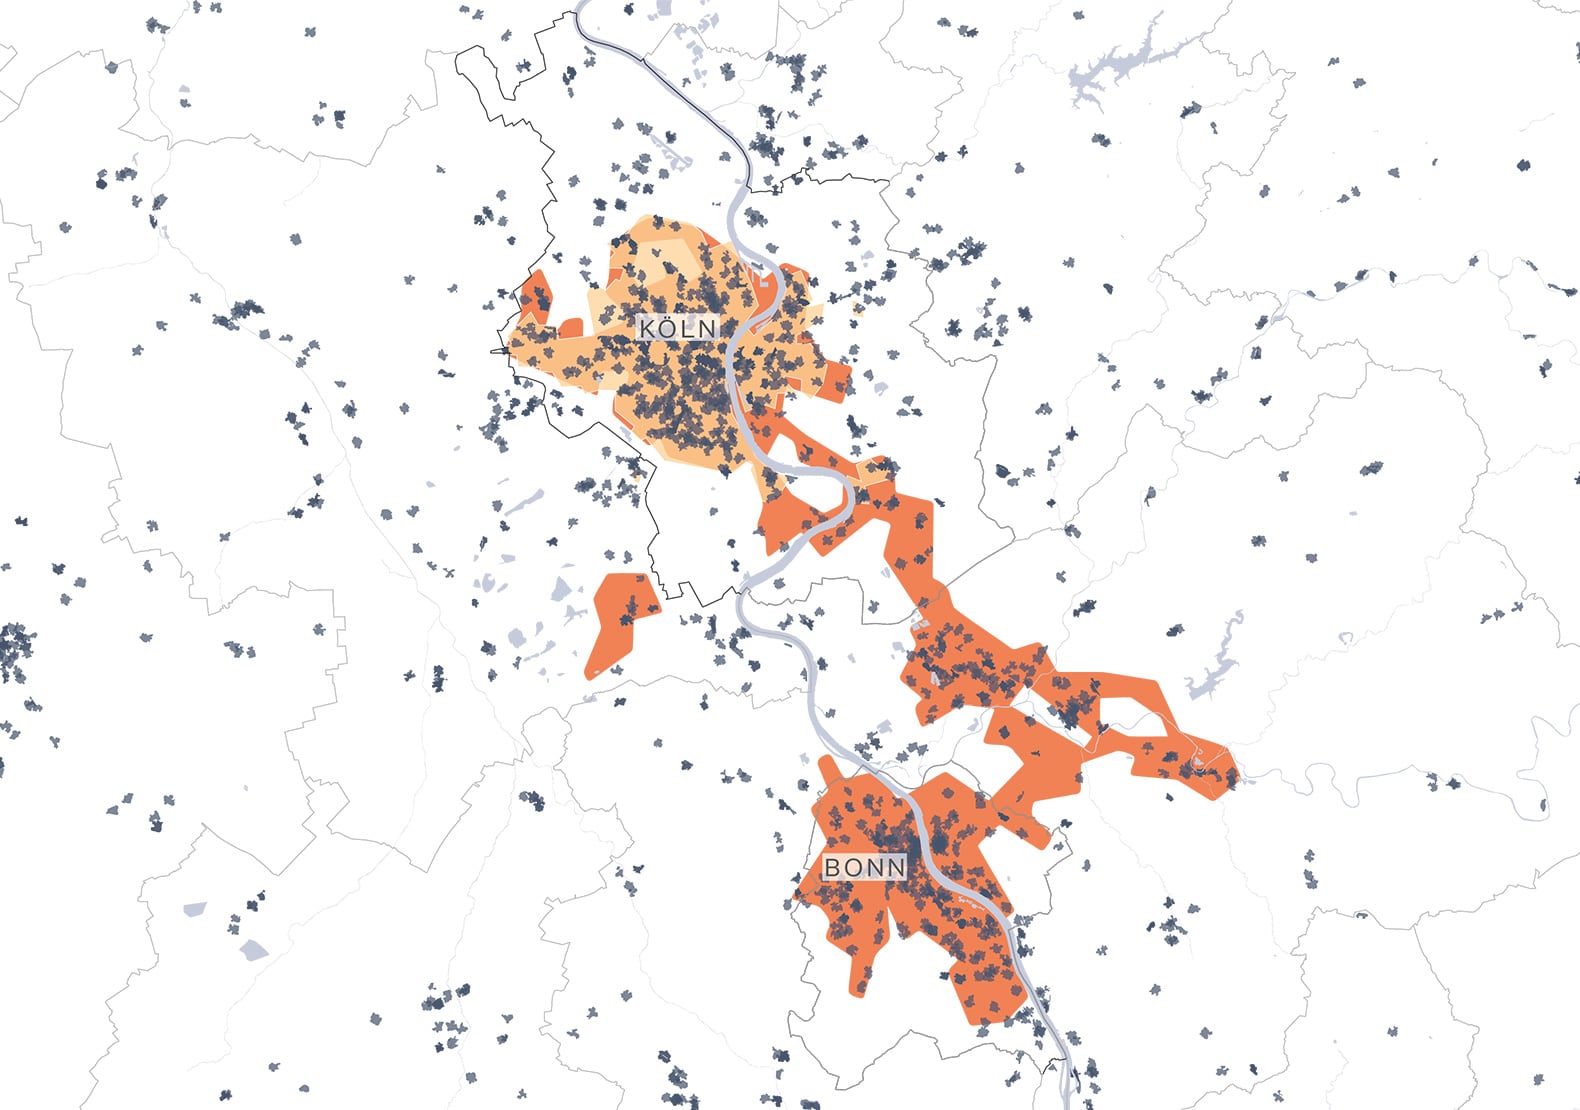
Germany is increasingly becoming a commuter country: as of 2023, 60 percent of all employees subject to social insurance contributions – over 20 million people – traveled from their home to their place of work every day. The appeal of economic centres such as Munich, Hamburg and Berlin remains unwavering. Of the 80 major German cities, Munich is still the frontrunner: around 450,000 people who work there live outside the city limits. Close behind are Frankfurt am Main (400,000), Hamburg (390,000), Berlin (390,000) and Cologne (310,000).
Commuter traffic is having an increasing impact on local residential markets in commuter belts. This is especially true for communities with the highest number of commuters, some of whose rents have, in some cases, risen more sharply in recent years than in the city centre. The strained residential markets in the centres are spilling over into suburban areas, attracting increased interest from investors.
Map description: The map shows the number of commuters from the 30-kilometer commuter belt of selected major cities, which can be chosen via a drop-down menu, at the municipal level. The commute to work does not necessarily have to be made every day. The municipalities with the strongest commuting links to the metropolis are shown in red. The development of asking rents between 2022-2024 is also shown for the Top 10 municipalities.


"Access to talented and creative people is to modern business what access to coal and iron ore was to steel-making." — Richard Florida
Europe is ageing – but many cities are getting younger. They are primarily growing due to young immigrants, both domestic and foreign, who move to the city to study or find a job. These young talents and highly qualified people are the basis for innovation and competitiveness. They are therefore particularly sought after in the international competition between cities.
The analysis of age structures and migration patterns of students and young professionals, and employment trends in high-income sectors provides insight into the growth potential of cities and communities in the transition to a knowledge economy.
If you want to strengthen regional innovation and competitiveness, you need highly qualified young people. Only cities that can attract and retain these talents in sufficient numbers will remain economically successful. After all, the choice of where to live and work often determines the rise or fall of entire regions – and also influences the development of residential markets.
In addition to major European cities such as Copenhagen, Amsterdam, Vienna, Munich and Berlin, numerous "smaller" German cities such as Leipzig, Regensburg, Jena, Heidelberg, Mainz, Darmstadt, Münster and Erlangen are also compelling. They attract students and young professionals and retain them long-term. These large cities, with high net migration gains among migrants seeking education and entry into the workforce, are the focus of residential investors. The main demand here is for residential properties that meet the needs of young, highly qualified talents, such as properties in urban locations with compact layouts and smart furnishings.
Map description: The extent to which cities have gained young people through immigration can be estimated using cohort analyses. The map shows the net increase in trainees/students and young professionals between 2017 and 2022 at NUTS 3 level. The relevant data for each region can be displayed by hovering over a region with your mouse.
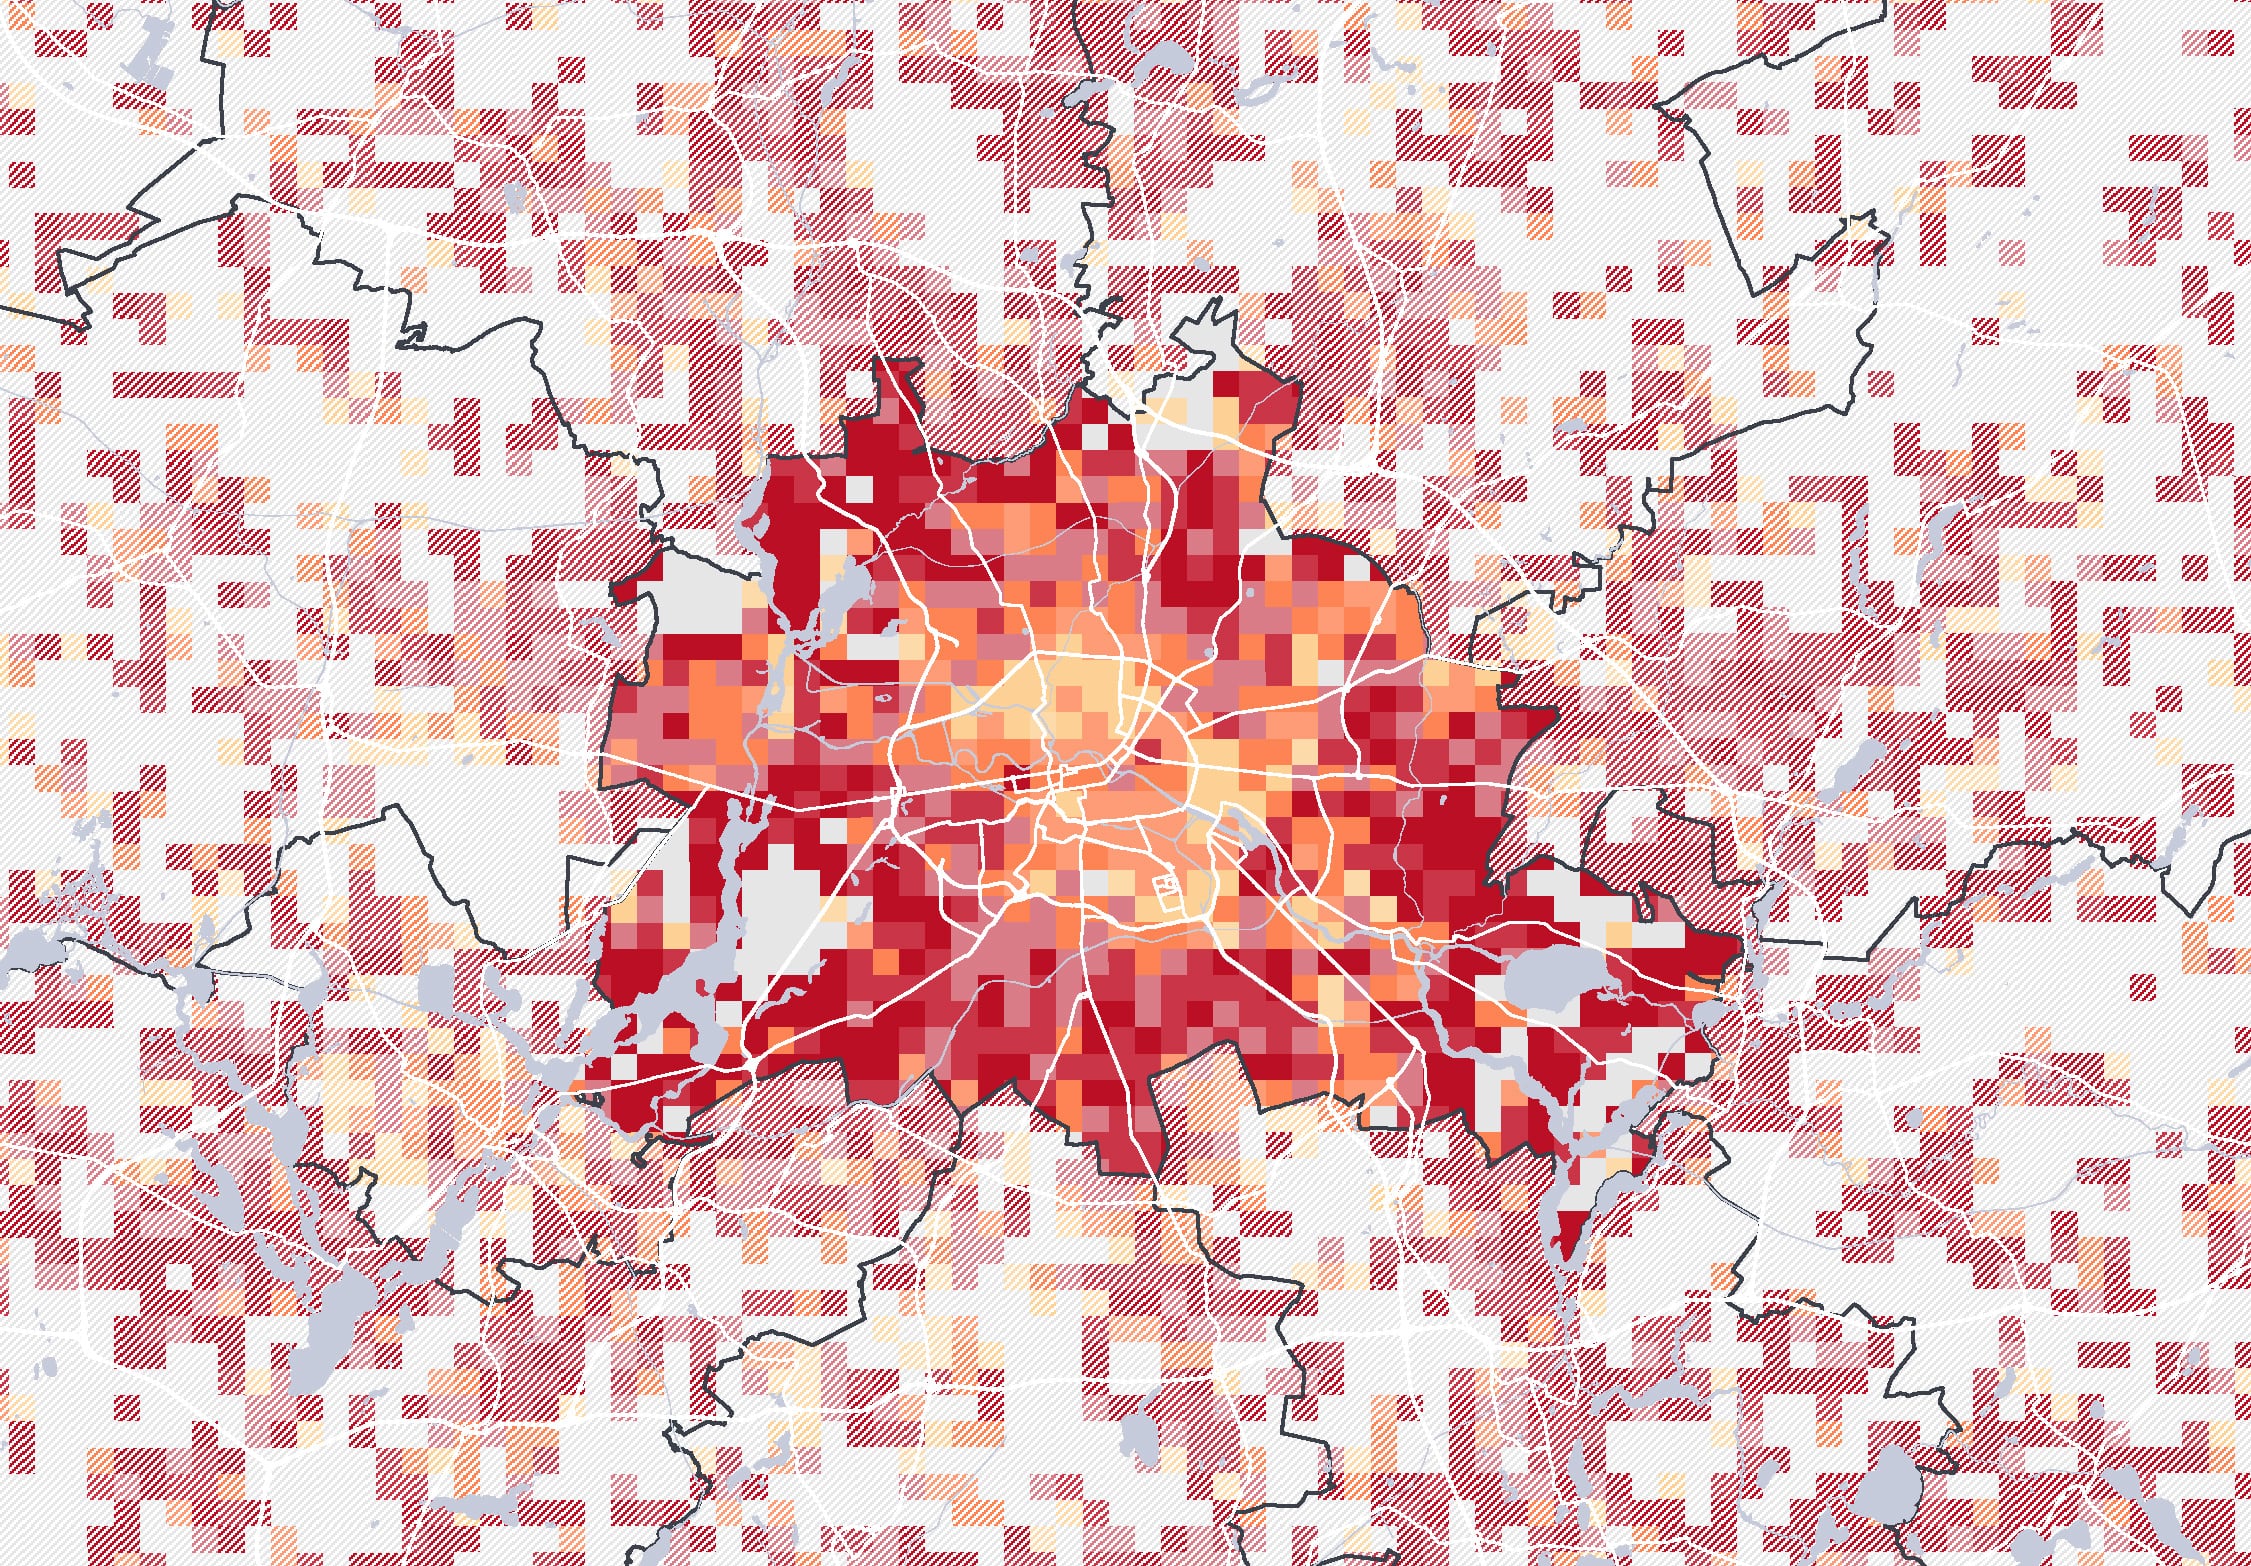
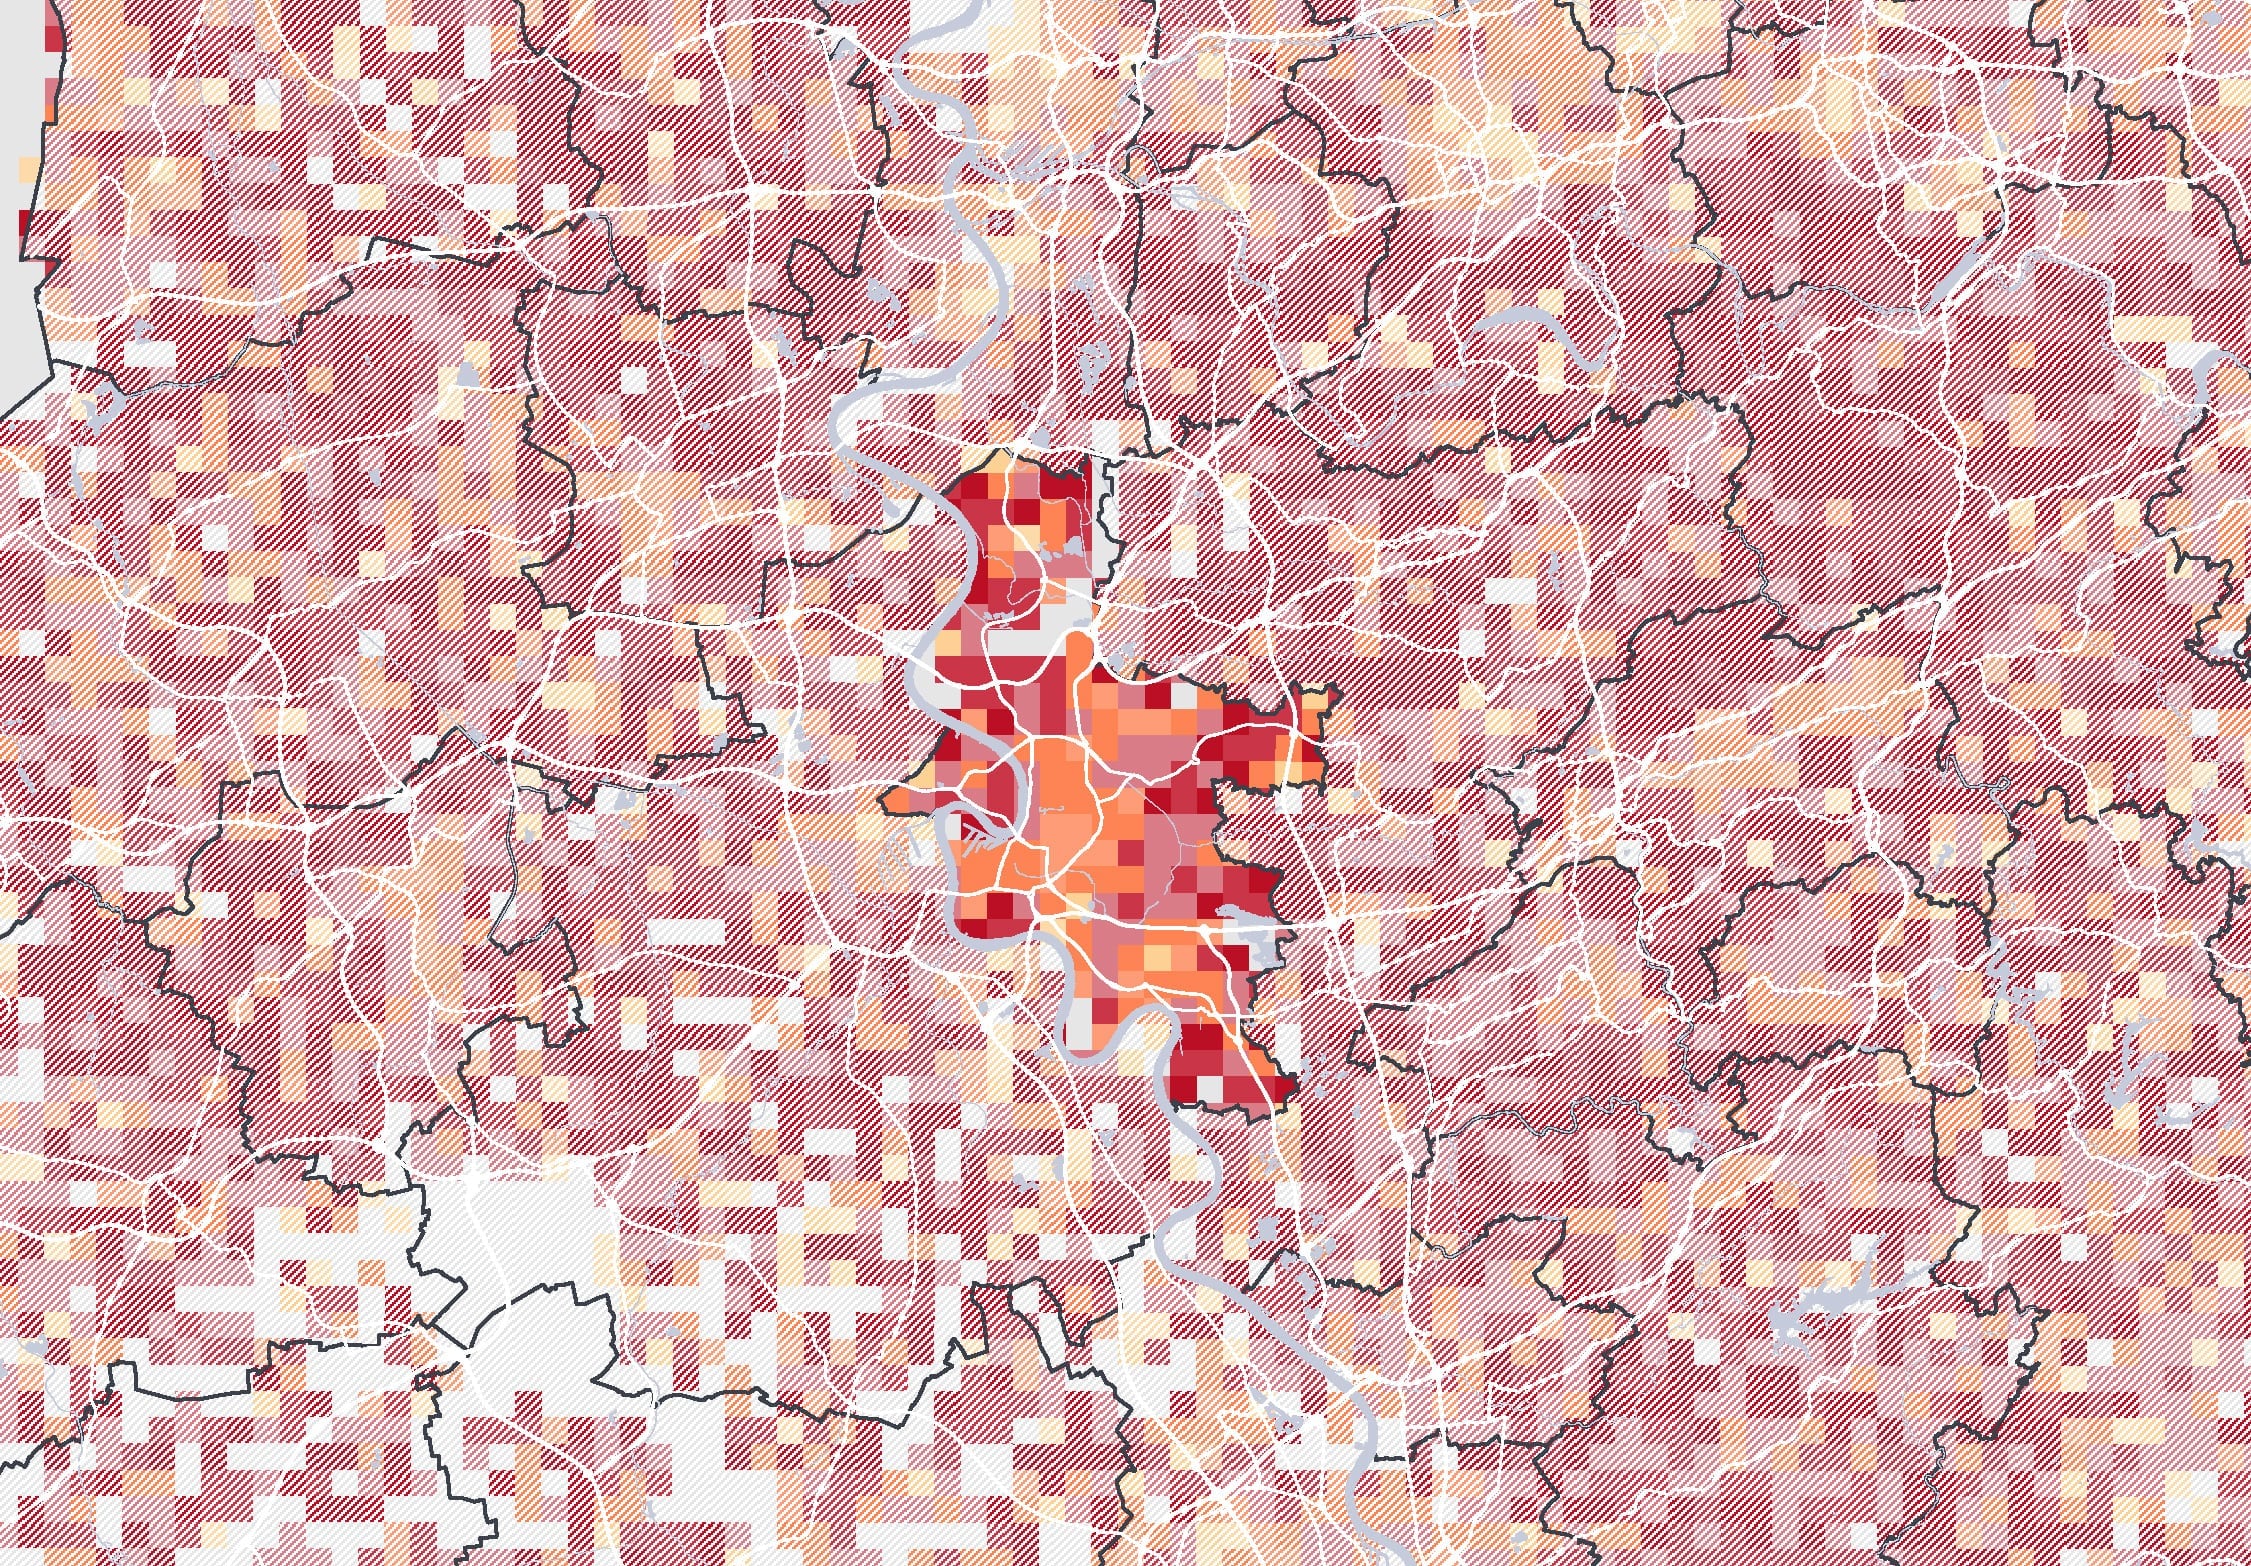
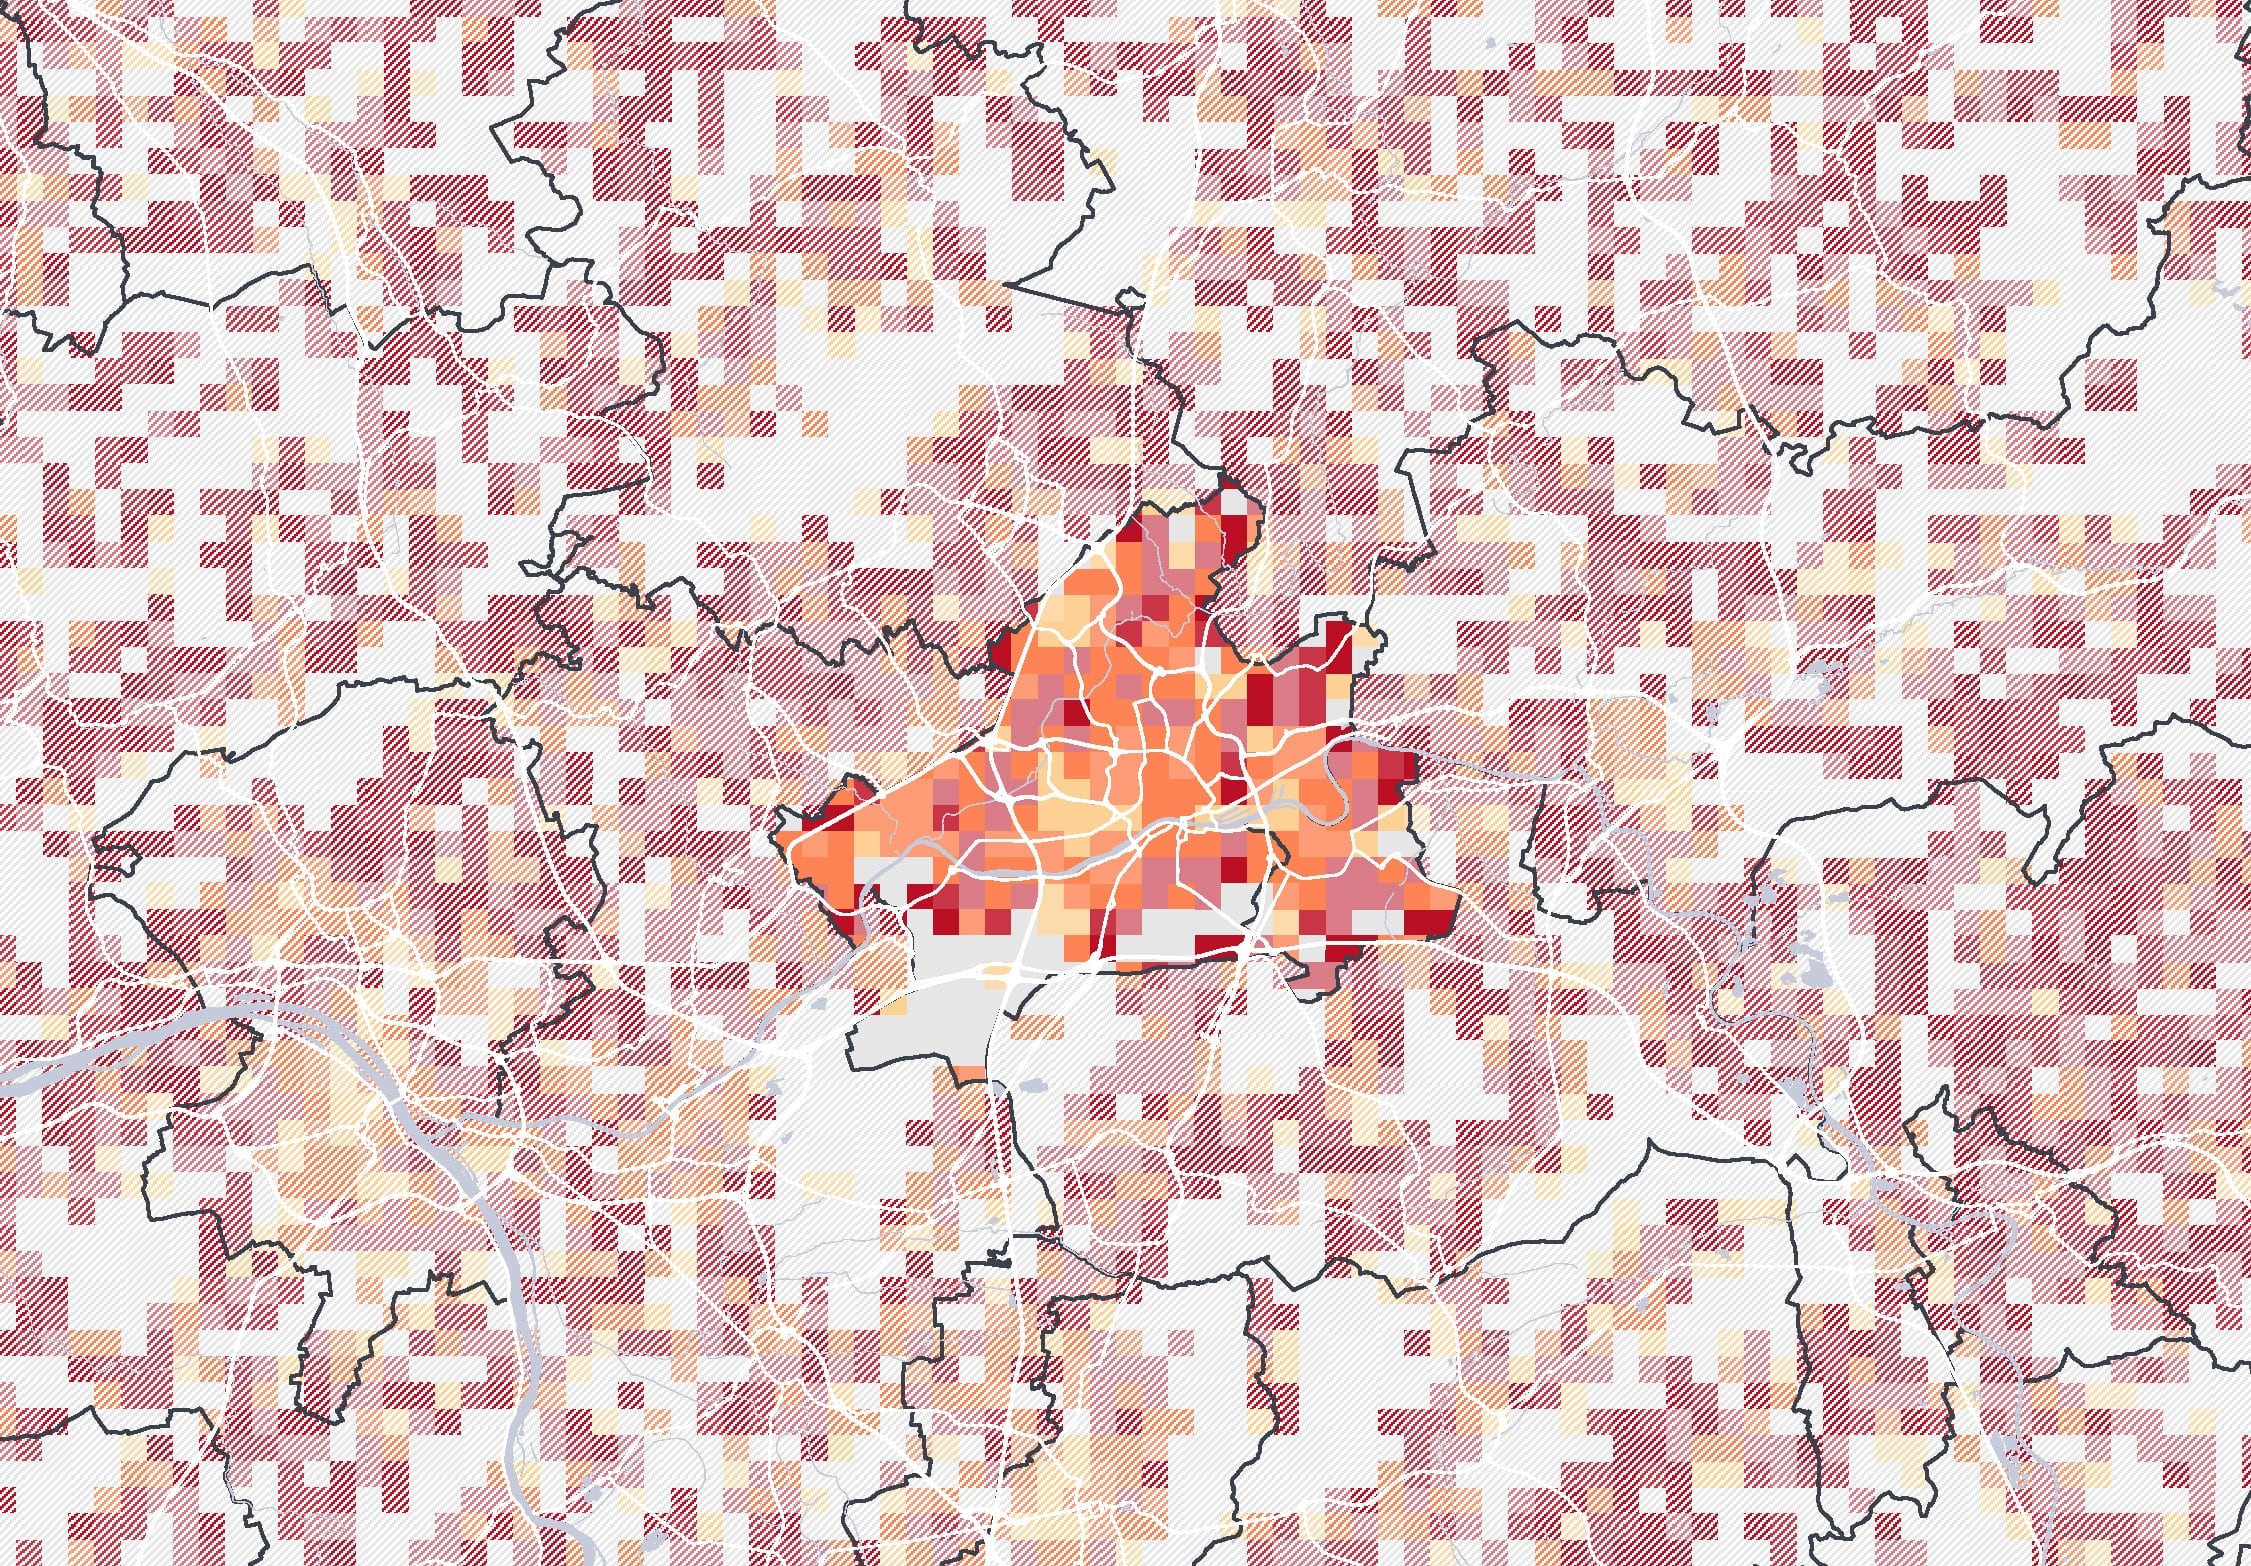
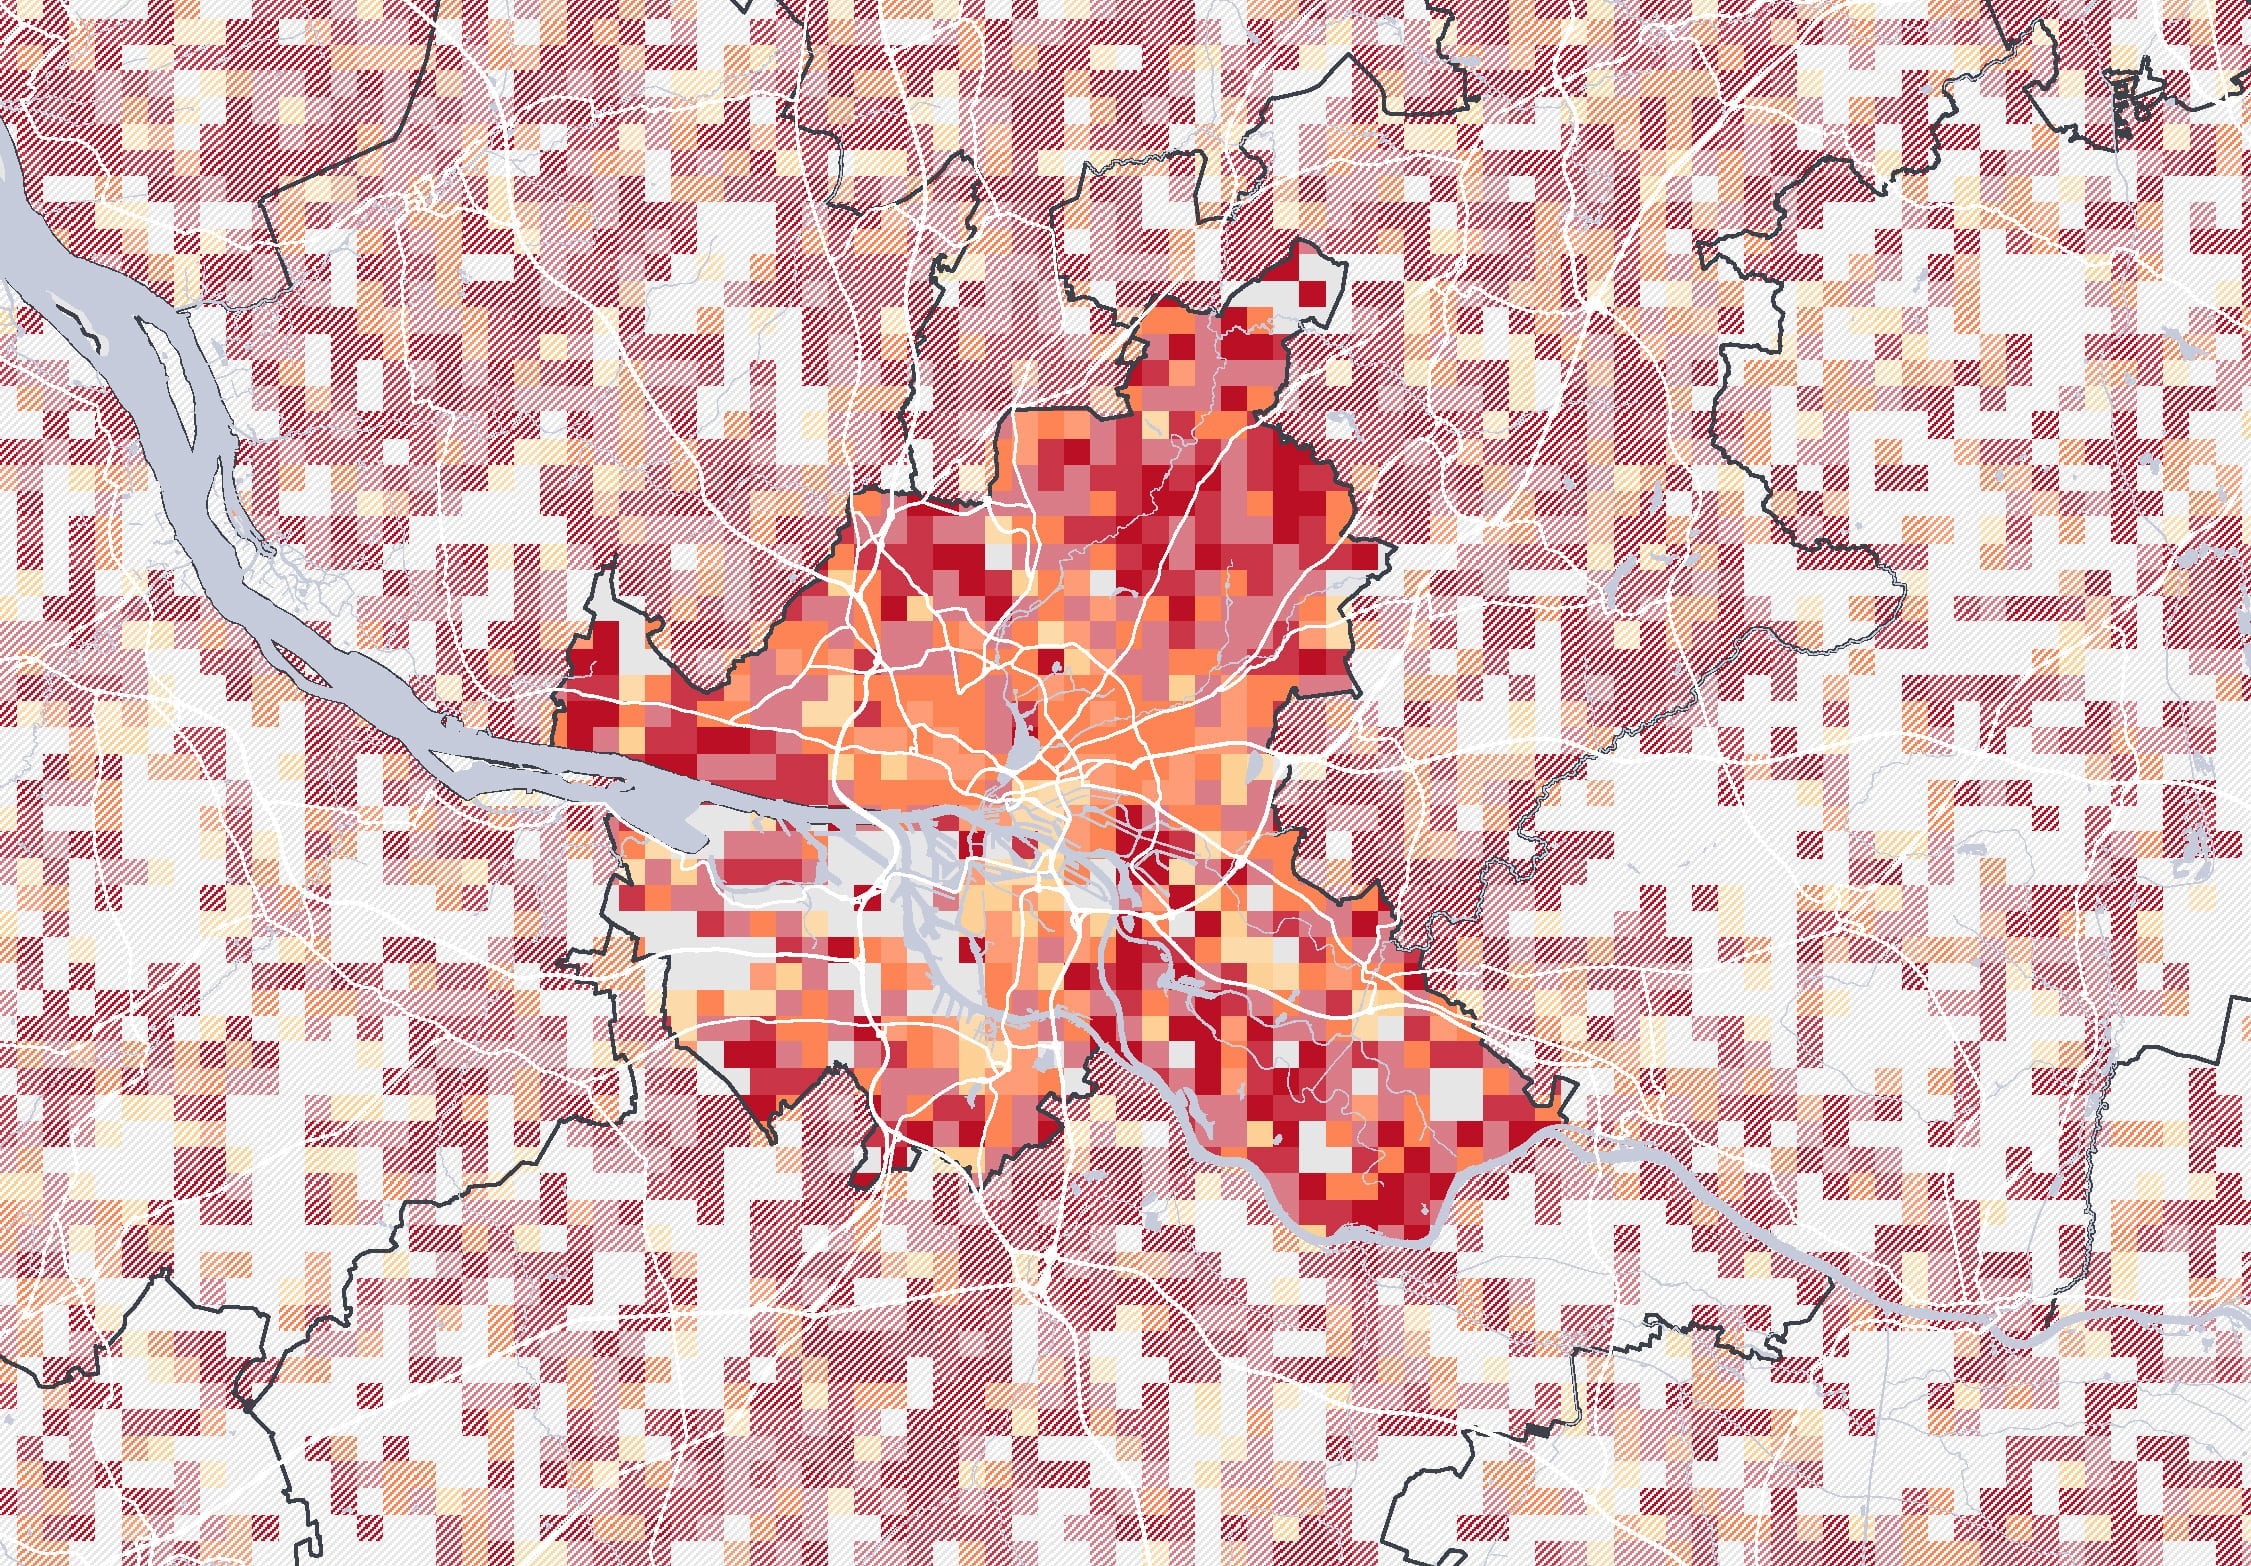
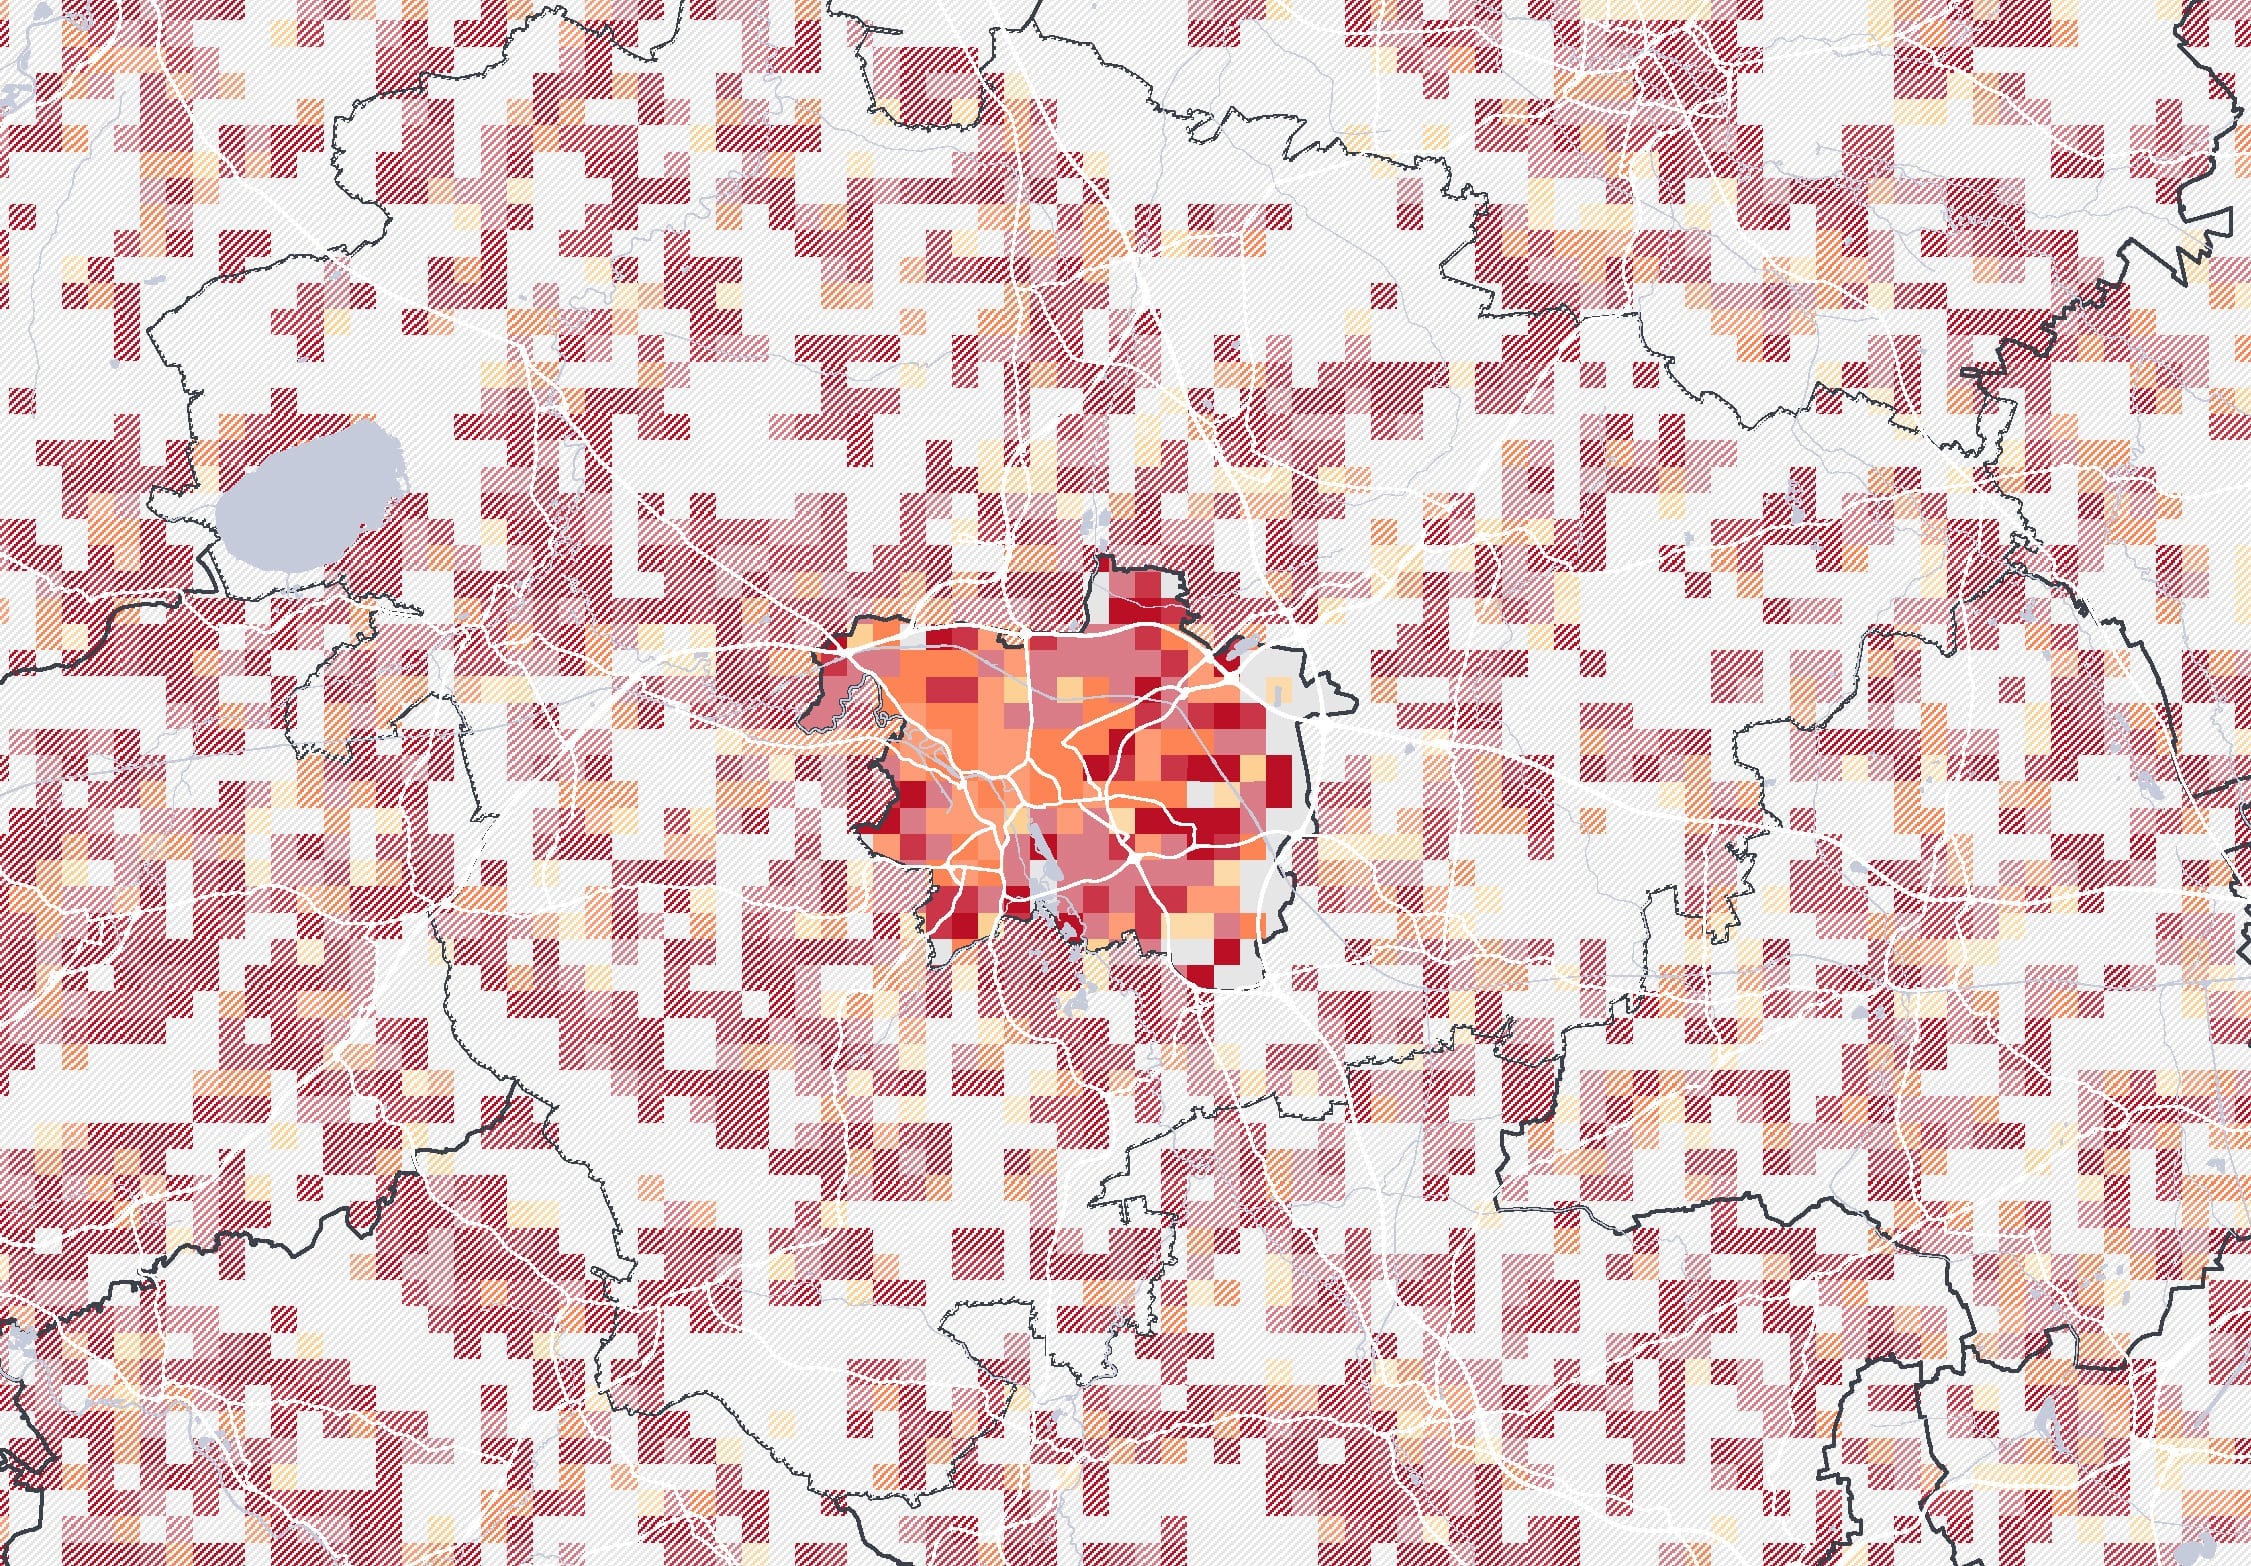
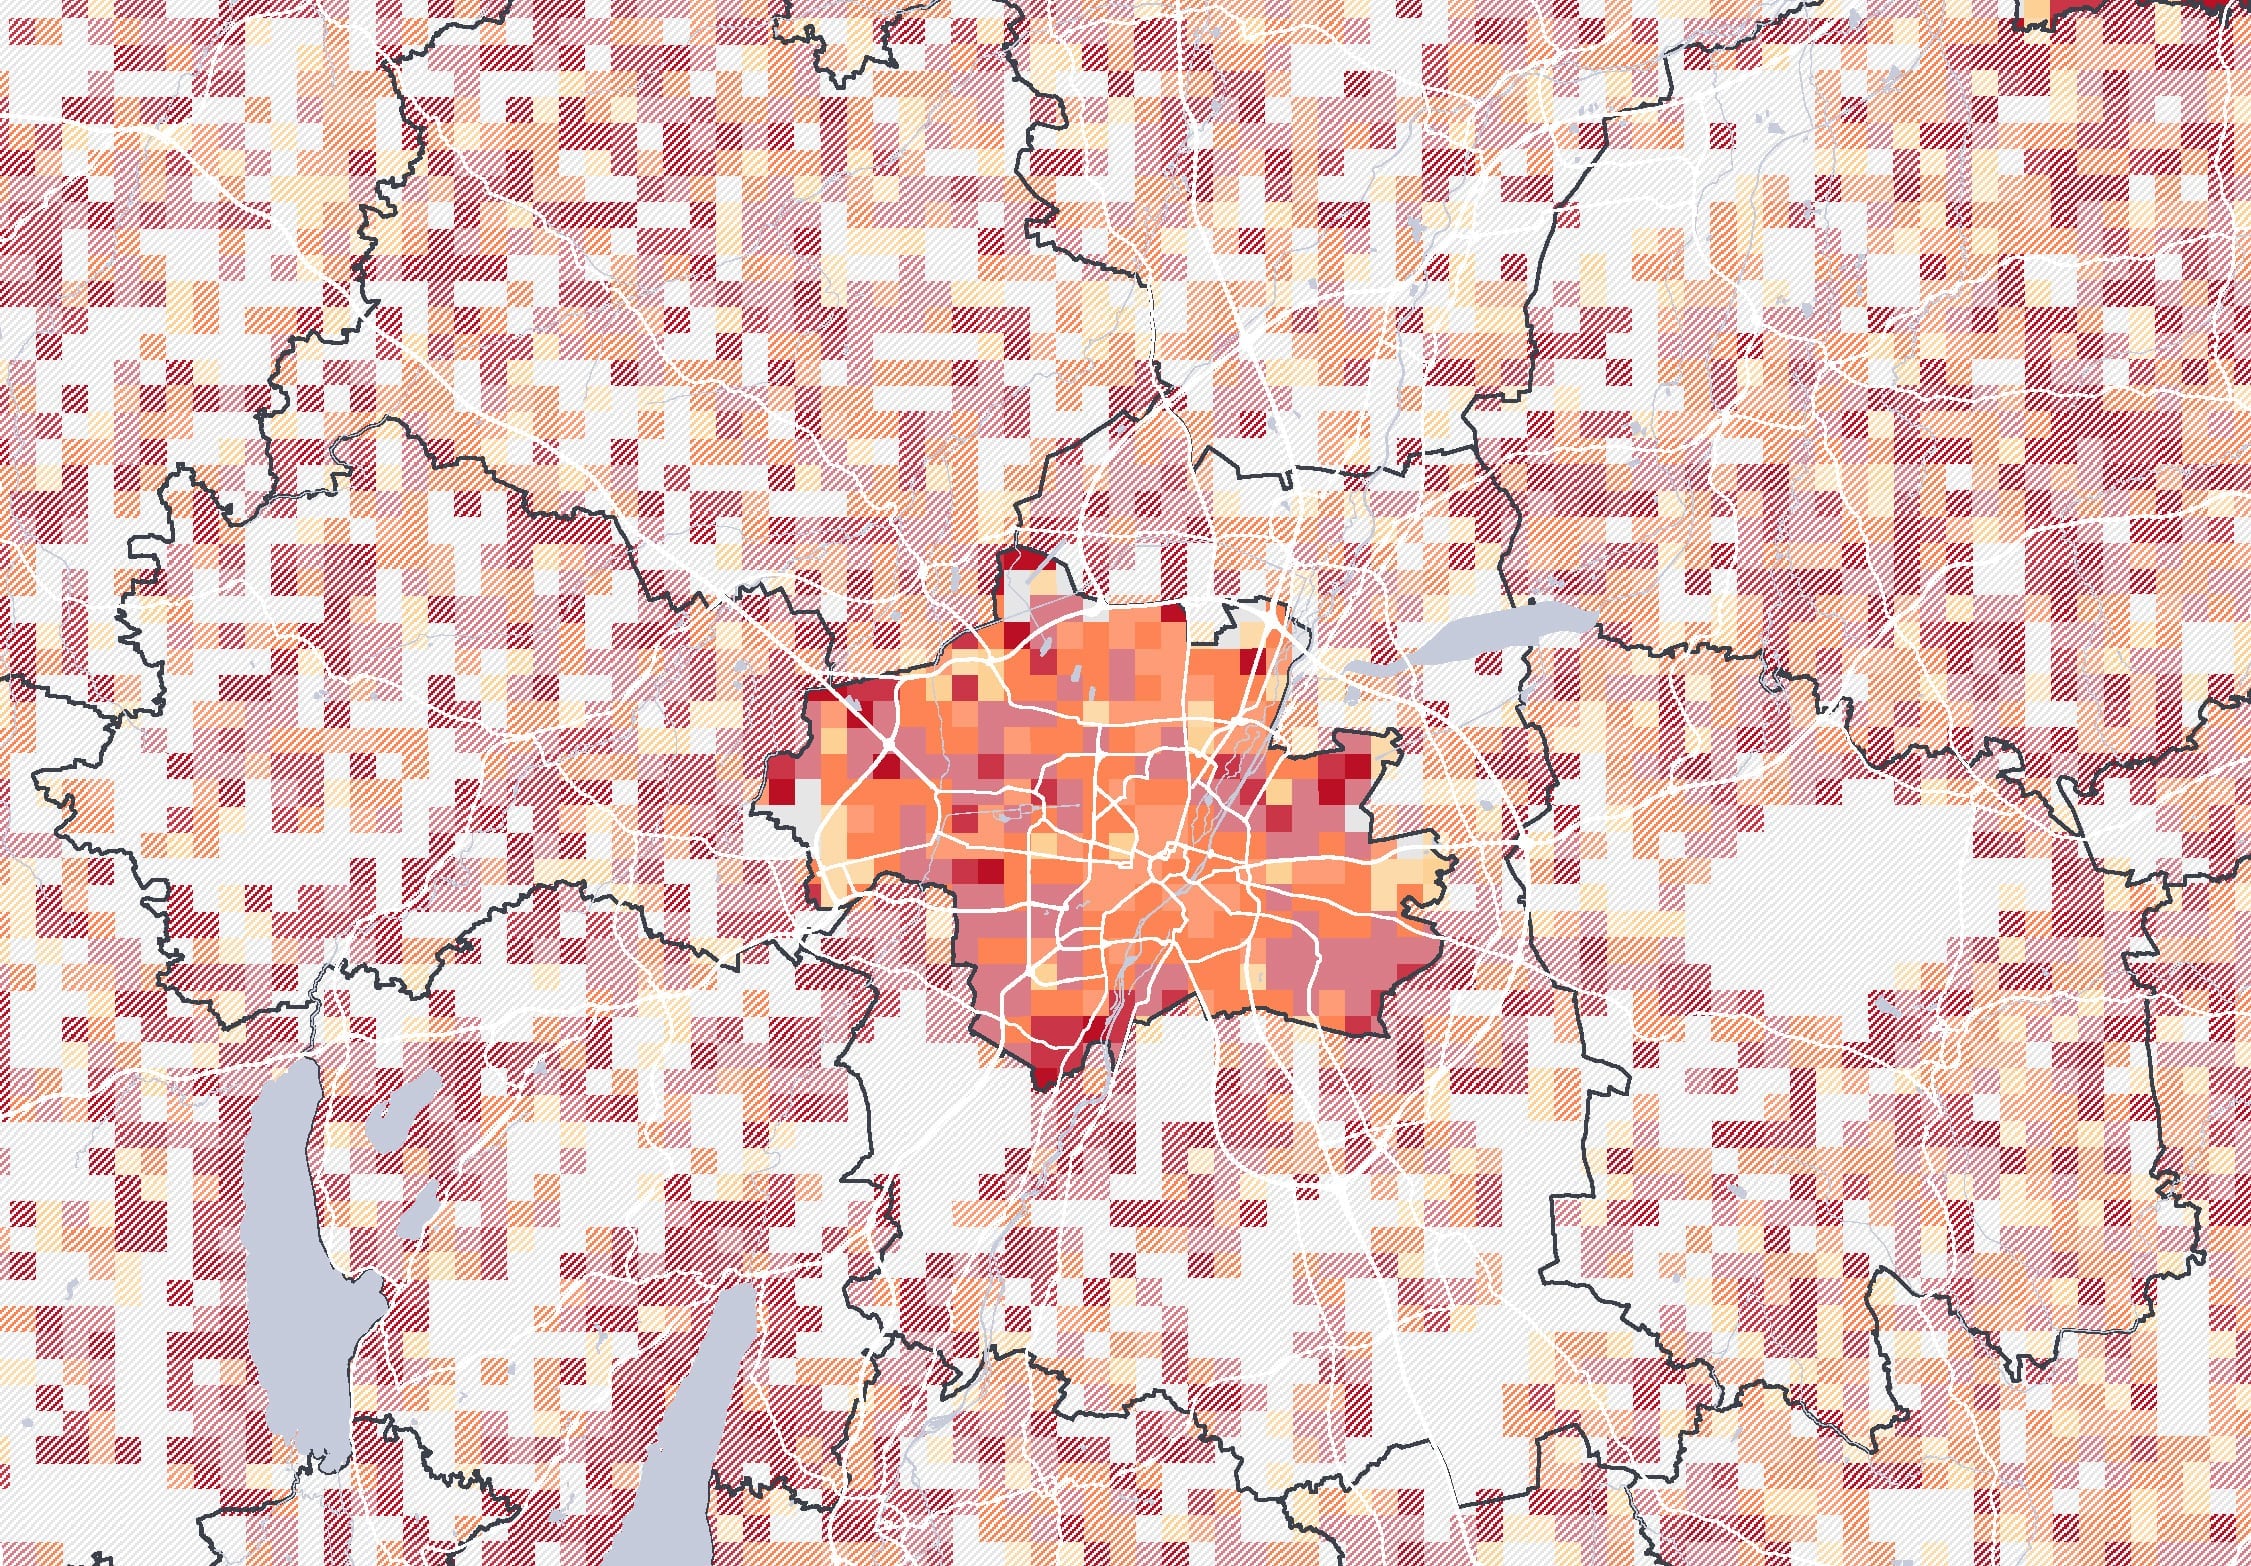
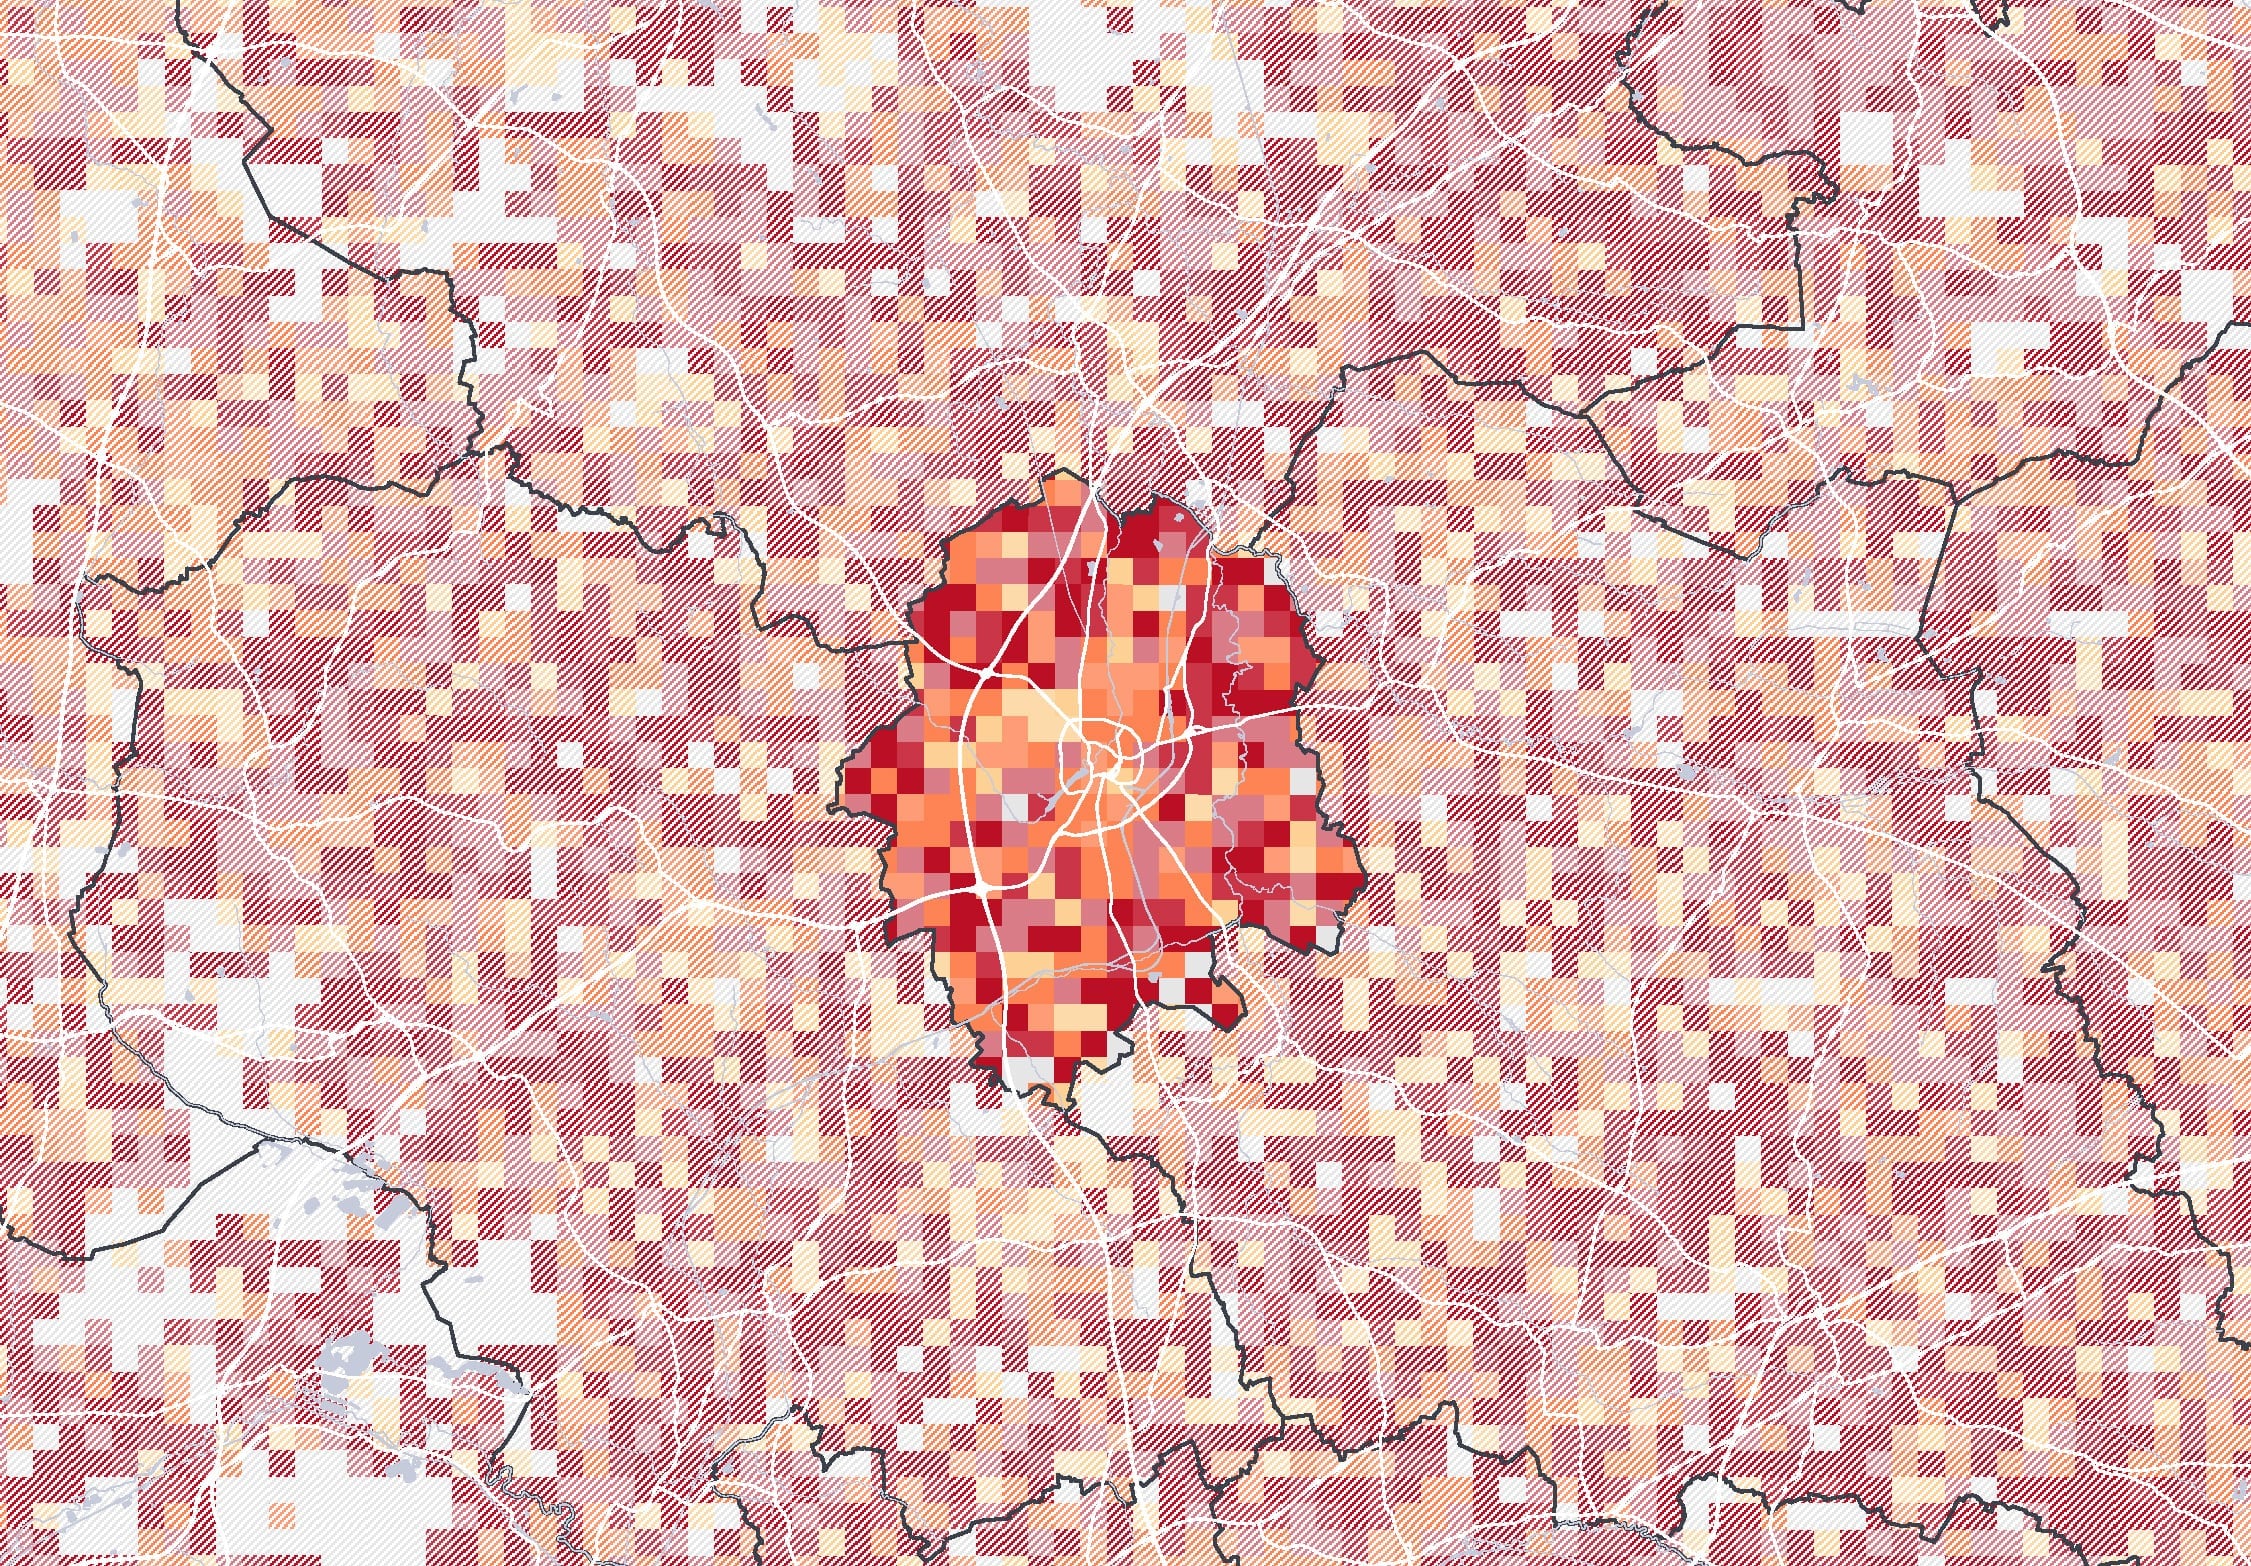
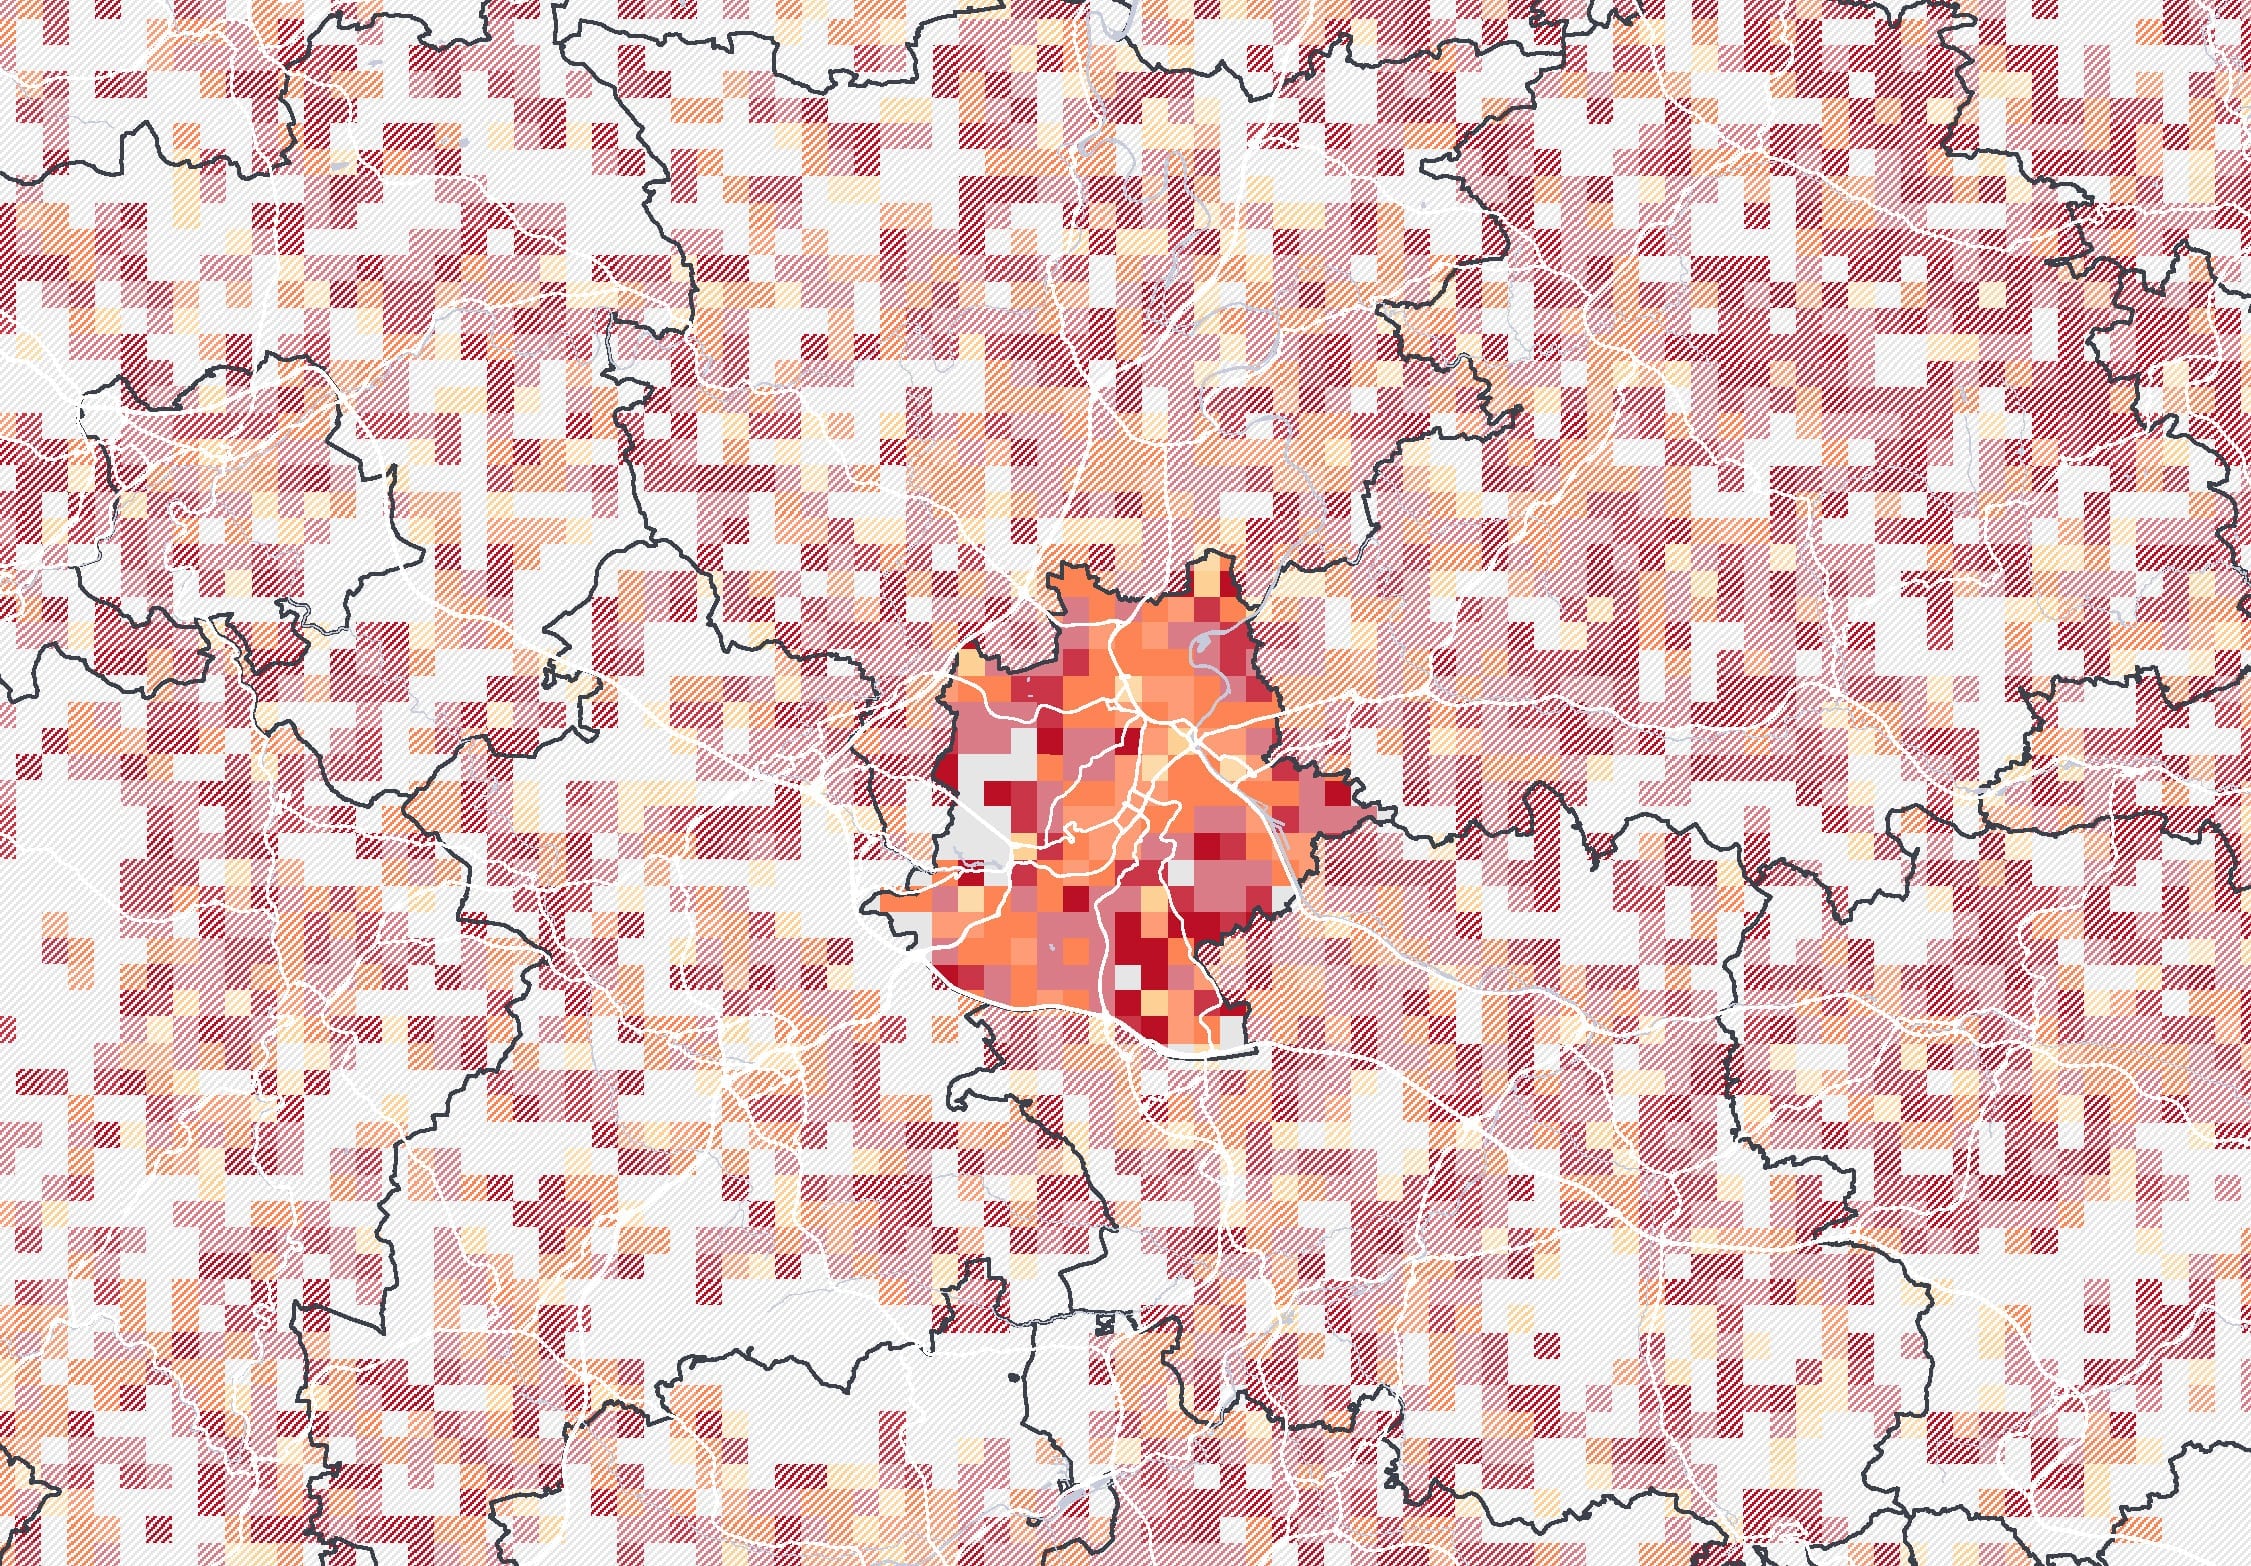
A large part of metropolitan growth stems from the positive balance of migration for education and entry-level jobs. Large cities are therefore generally younger than smaller municipalities or rural areas. In 2022, around 38 percent of the population across Germany was between 18 and 49 years old, while in the Top 7 cities, it was 45 percent. Within cities, young adults migrating to Germany are also primarily drawn to the inner cities and urban districts close to the city centres. In all major cities, these areas have a significantly lower average age of 35 to 40 years (the German national average: approx. 44 years, Top 7 cities average: approx. 42 years).
City life is often a lifestyle choice, especially among young adults. Urban living is sought not only because of a diverse range of leisure activities in the city centre, but also for the daily atmosphere of the living environment, everyday urban life. Inner-city residential areas with short distances, well-developed infrastructure and leisure and community facilities are in demand.
Map description: The maps show the average age per km² for selected German cities based on data from the 2022 census.
Highly skilled and creative professionals are primarily looking for cities where they can choose from a wide range of knowledge-intensive and well-paid jobs, such as roles in IT, consultancy or engineering. Regional analyses show an increasing spatial concentration of these professional groups in the Top 7 cities and their surrounding areas as well as in selected major cities (e.g. Karlsruhe and Erlangen for the IT sector, Wolfsburg and Böblingen for the mechanical engineering sector, Hochtaunus district for the consultancy sector).
At the same time, these regions are notable for their dynamic growth in new rental agreements. The reasons for this are the strong demographic development and the flourishing economy, especially in future-oriented professions such as technical development, software development or programming. The same applies to engineers and consultants: wherever employees in these sectors are concentrated, their above-average salaries have a direct impact on the housing market – driving rental prices even higher.
Map description: The maps show the location quotients at district level for the three professional groups: engineers (e.g. technical research), consultants (e.g. business and tax consultancy) and IT (e.g. software development, programming). For this purpose, the proportion of employees subject to social insurance contributions in the respective professional group within the overall workforce is calculated both for the sub-region and for Germany (location quotient). A value <100 (respectively >100) indicates that employment in the respective occupational group in the sub-region is proportionally under-concentrated (or over-concentrated) in relation to Germany.
 Top 10
"The individualization of lifestyles leads to a plurality of needs that must be addressed by society." — Ulrich Beck
In many respects, the housing supply in Germany no longer meets the needs of changing household structures and living requirements. The requirements for apartments in terms of size, layout and furnishings have become more diverse in response to different lifestyles. What is particularly lacking is small apartments and innovative, flexible living concepts, as well as nursing home places for an ageing society. Need varies greatly from region to region.
In Europe's major cities, housing is being redefined: with the influx of young people, flexible life plans and growing job mobility, modern forms of housing such as micro-apartments, student residences, co-living or serviced apartments are increasingly establishing themselves as an important component of the housing supply. They not only offer furnished living space with availability at short notice, but also communal areas (including kitchens, fitness areas, co-working spaces) and services (e.g., cleaning) that the traditional housing market cannot provide. The result? A versatile offering that perfectly complements the traditional housing market – ideal for students, apprentices, young professionals, commuters, project staff and expats.
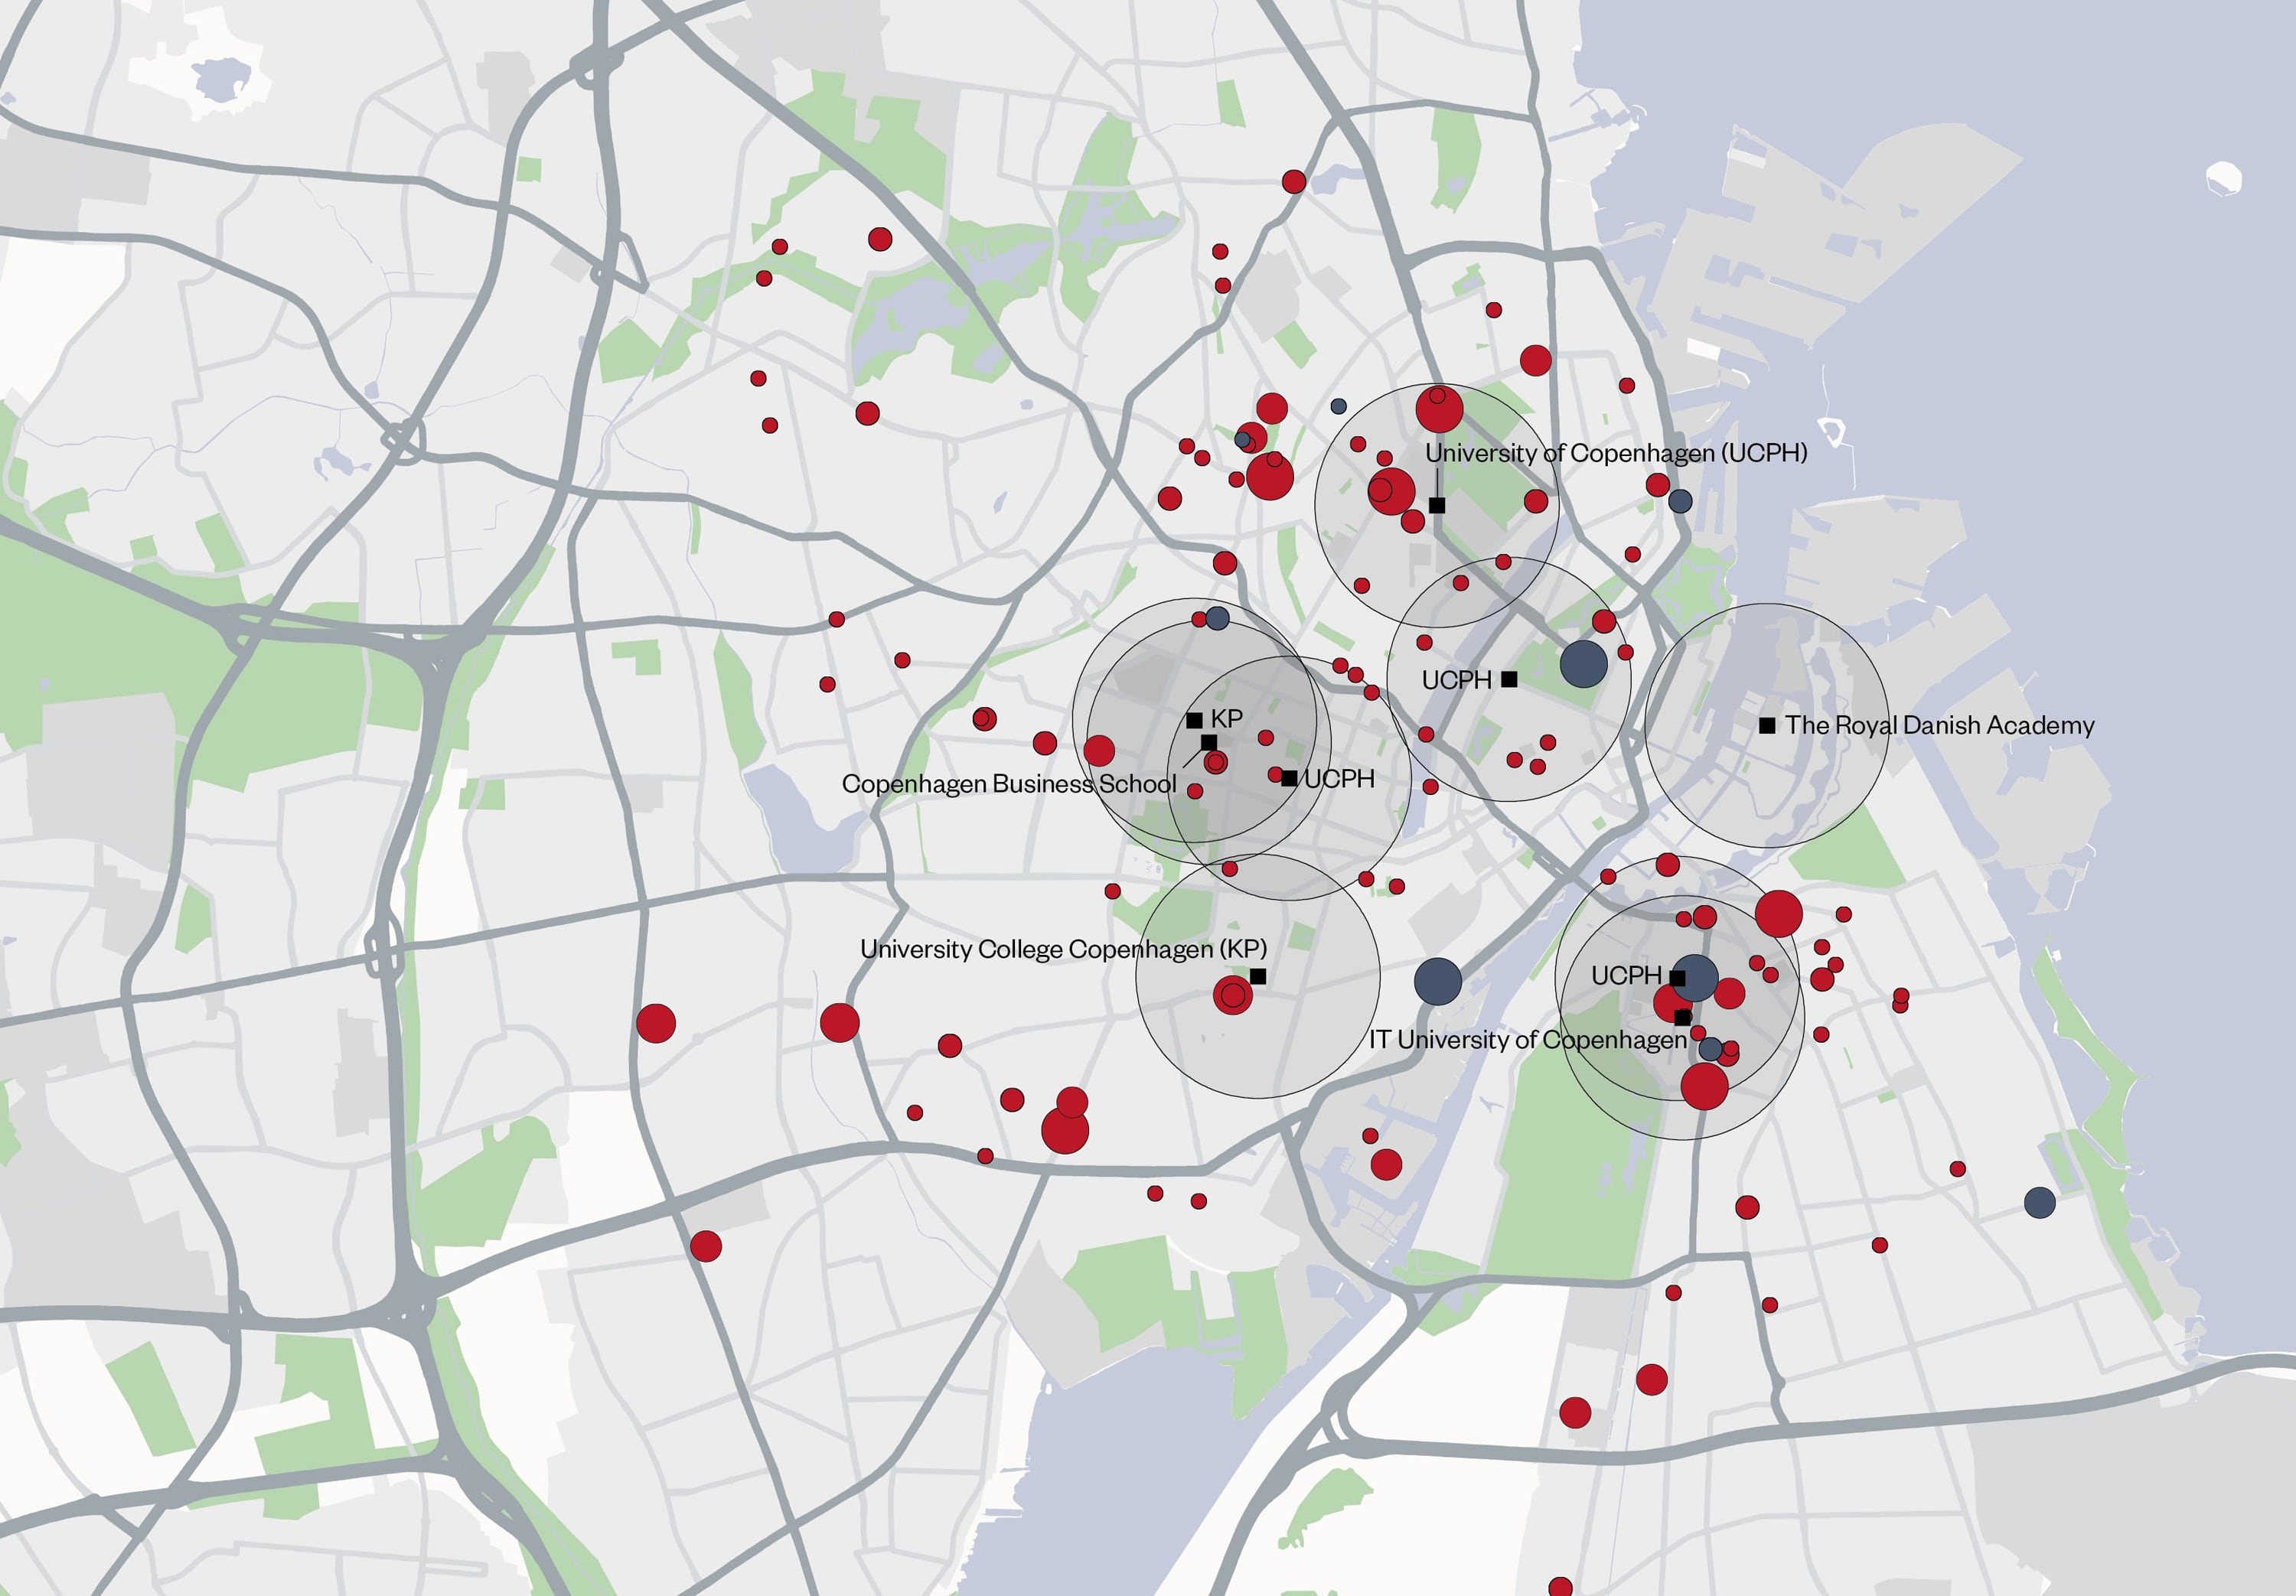
Even in the vibrant metropolis of Copenhagen, the supply of modern forms of housing can barely keep pace with the rapidly growing demand, and further rent increases are therefore inevitable. Opportunities in terms of market potential are seen in both the student and non-student segments, particularly in central and well-connected locations.
Map description: The map shows the modern housing options in the form of student apartments and serviced apartments as well as the largest universities in the central Copenhagen district of Indre By. The overview map shows the proportion of small apartments (<40 m²) in the individual districts of Copenhagen.
 Universities
 Radius 1 km
 ≤ 100
≤ 100 ≤ 200
≤ 200 ≤ 300
≤ 300 ≤ 400
≤ 400 > 400
> 400 ≤ 100
≤ 100 ≤ 200
≤ 200 ≤ 300
≤ 300 ≤ 400
≤ 400 > 400
> 400
45 percent of all working people in Germany live alone or as a couple without children; in the Top 8 cities the figure is over 50 percent. Due to increasing (international) job mobility, new household types such as Living Apart Together, Modern Nomads and people living in multiple locations have become widespread. The housing profile of these dynamic and often highly qualified lifestyles is heavily focused on small and high-quality apartments in inner-city locations in the German metropolitan regions.
In many respects, the housing supply no longer meets the needs of these new household structures and lifestyles. There are too few small apartments, especially in the metropolitan regions. In Berlin, there are more than 980,000 working singles and couples versus roughly 734,000 apartments with less than 60 m² of living space. Hamburg and Munich are also lacking approximately 168,000 and 157,000 suitable residential units respectively. Regionally, the supply situation for small apartments is particularly tight in North Rhine-Westphalia and the Rhine-Main region as far as Stuttgart and the surrounding area.
This means that small apartments will remain in demand almost across the board in the future and will continue to show dynamic rental price growth.
Map description: The map shows the undersupply of small apartments for working one-person and two-person households at district level, from low to high. The undersupply is given in absolute terms (number of working singles and couples minus the number of apartments with less than 60 m² living space). The respective data of the towns and districts can be displayed using the mouse.
As the baby boomer generation ages, the need for inpatient and outpatient care services will continue to grow significantly. Over 800,000 of the 5.7 million people in need of care in Germany are currently receiving full-time inpatient care in around 16,500 nursing homes.
By 2040, it is expected that more than 6.7 million people will need care and, depending on the scenario, up to 1.6 million nursing home places will be required. In spatial terms, most people in need of long-term care are expected to live in cities, as many people have moved to cities in recent decades and the frequency of moving house in old age is simultaneously falling.
For institutional investments, locations along the expansion path of professional care companies with a high demand for care and a sufficient labor pool are of particular interest. Accordingly, the locations of the Top 10 nursing home operators are mainly concentrated in metropolitan regions.
Map description: The map shows the projected absolute number of people in need of care in nursing homes at district level in 2040, as well as the locations of the Top 10 operators in 2024. The respective data of the towns and districts can be displayed using the mouse.
 Locations
Top 10 operators 2024
Locations
Top 10 operators 2024
"Resilience is not an asset but a progress of change" — Simin Davoudi
With their high population density, extensive paved areas and a high proportion of the resulting CO2 emissions, cities are both drivers and especially vulnerable hot spots of climate change. Resilience is often seen as part of risk management, with the aim of strengthening resistance to extreme weather events and adaptability to the impacts of climate change. However, it is also about the transformative capacity of cities and buildings to reduce the impacts of climate change on people and property.
Heavy rain has caused massive damage and subsequent costs in recent years. Flash floods like the one in the Ahr Valley in 2021 have shown the dangers to people and infrastructure. At over 40 billion euros in damages, it was the extreme weather event with the greatest losses in German history to date. Current climate models assume that even more intense extreme weather events will become more frequent in the future. In southern and southwestern Germany in particular, over 15 days of heavy rainfall per year are expected in some municipalities, for example around Lake Constance, by the middle of the 21st century.
Despite the increasing risk of flooding, people are still building in flood-prone areas. In around 68 percent of all municipalities in Germany, more than five percent of the designated floodplain is built on. The buildings and traffic areas located there are prone to flood during extreme flooding. Here, too, the main risk is in the southern half of Germany, where many flood-prone areas have a medium to high level of settlement density.
Worldwide, it is clear that only a portion of extreme weather damage is covered by insurance. In 2023, this accounted for only 38 percent of the approximately USD 280 billion worldwide. In general, extreme weather events also lead to higher insurance premiums. For example, in Australia, 15 percent of households spend more than a month's salary to insure their homes against fire and flood. In the United States, insurance premiums tripled between 2001 and 2021. In Germany, where flooding is becoming more frequent, it is predicted that home insurance premiums will double in the next 10 years.
Map description: The shading of cities and districts shows the proportion of built-up settlement and traffic areas within the territory of the officially designated floodplain. In the case of a high settlement density, more than 10 percent of the floodplain is built up with settlement areas (excluding open spaces) or traffic areas. The size of the circle represents the predicted number of heavy rainfall days (precipitation of at least 22 mm) in the middle of the 21st century (2036 to 2065). The depicted scenario corresponds to RCP scenario 4.5 (moderate climate protection) of the Intergovernmental Panel on Climate Change (IPCC) (2017). The respective data of the towns and districts can be displayed by hovering the mouse over the desired area.
 ≤ 4 (low)
 ≤ 6 (medium)
 > 6 (high)
Temperatures in densely populated areas with a lot of impermeable surfaces are already higher all year round than in the surrounding rural areas (referred to as heat islands). The number of hot days will continue to increase in the future. There are regional differences: While there could be an average of 5.4 days per year with temperatures above 30°C in Hamburg between 2036 and 2065 (today: 3.6 days), there will be 12.2 days in Cologne (today: 7.5 days). It will get particularly hot in Ludwigshafen (20 days), Karlsruhe (18.7 days) or Mainz, Darmstadt, Heidelberg and Heilbronn (around 16 days each).
Heat islands are mainly caused by a high level of impermeable surfaces and a lack of vegetation. Dark, impermeable surfaces such as roads and buildings store heat and also heat up the air even more. In contrast, permeable "unsealed" green spaces and trees have a cooling effect through evaporation and shading. This climate-regulating effect is greater the higher the volume of greenery (an older tree population with dense canopies cools better than a grassy area). In German cities with more than 50,000 inhabitants, the average volume of green space is 3.4 m³ per m². Kaiserslautern (6.7 m³) and Baden-Baden (6.2 m³) are especially green.
Heat is particularly dangerous for the health of vulnerable population groups, but affects the well-being of all urban residents. In the long term, microclimatic conditions could also play a role in how people choose a place of residence within Germany. In the future, the most pleasant places to live will continue to be those where as few surfaces as possible are sealed and are instead densely planted with greenery. This applies at the city-wide level as well as at district and property level. Large-crowned trees, green roofs or façades and shading elements increase the quality of life and thus the attractiveness and rentability of neighborhoods and residential properties.
Map description: The map shows how heat-resilient selected German cities are. In essence, the greener the better. The shaded area shows the proportion of settlement and traffic areas that are permanently sealed with buildings and roads. The trees symbolise the green volume (including trees and shrubs, but not just grass areas). The number of hot days (maximum temperature of more than 30°C) refers to the forecast of the Intergovernmental Panel on Climate Change (IPCC) until the middle of the 21st century (2036 to 2065) in the case of moderate climate protection (RCP scenario 4.5).
 ≤ 2
≤ 2 ≤ 4
≤ 4 ≤ 10
≤ 10 Less than 10 days
 10-15 days
 more than 15 days4.7 days
 9.2 days
 10.8 days
 11.4 days
 9.7 days
 16.2 days
 10.3 days
 11.6 days
 12 days
 10.8 days
 13.1 days
 5.4 days
 16.1 days
 15.7 days
 10.8 days
 18.7 days
 12.2 days
 8.5 days
 11.6 days
 20 days
 6.8 days
 16.3 days
 9.5 days
 7.6 days
 11.3 days
 4.8 days
 8.6 days
 11.7 days
 11 days
 5.8 days
Trees have a positive effect on the urban climate. They cool with their shade and remove heat and pollutants from the air. The larger the tree (and thus the tree crown), the greater the effect. Between 2003 and 2019, measuring stations in Vienna's inner-city, densely built-up area regularly recorded twice as many hot days with temperatures over 30°C (maximum 63 days in 2018) as in the Wienerwald. The cooling effect of grass lawns is two to four times lower than that of green areas with trees. Not all green spaces are created equal.
This approach is not only intended to strengthen city planning principles, but can also be implemented at property level and district level. The quantitative target values enable a targeted and measurable implementation of high-quality greening of properties, project developments and neighborhoods. This not only contributes to increasing the attractiveness of the residential area and the quality of time spent in the outdoor areas, but also has a positive effect on the local microclimate and residents' health.
Map description: The maps show the locations of public trees with crown diameters in Berlin and Vienna.
 not known
 up to 3 m
 up to 6 m
 up to 9 m
 up to 12 m
 up to 15 m
 up to 18 m
 up to 21 m
 more than 21 m
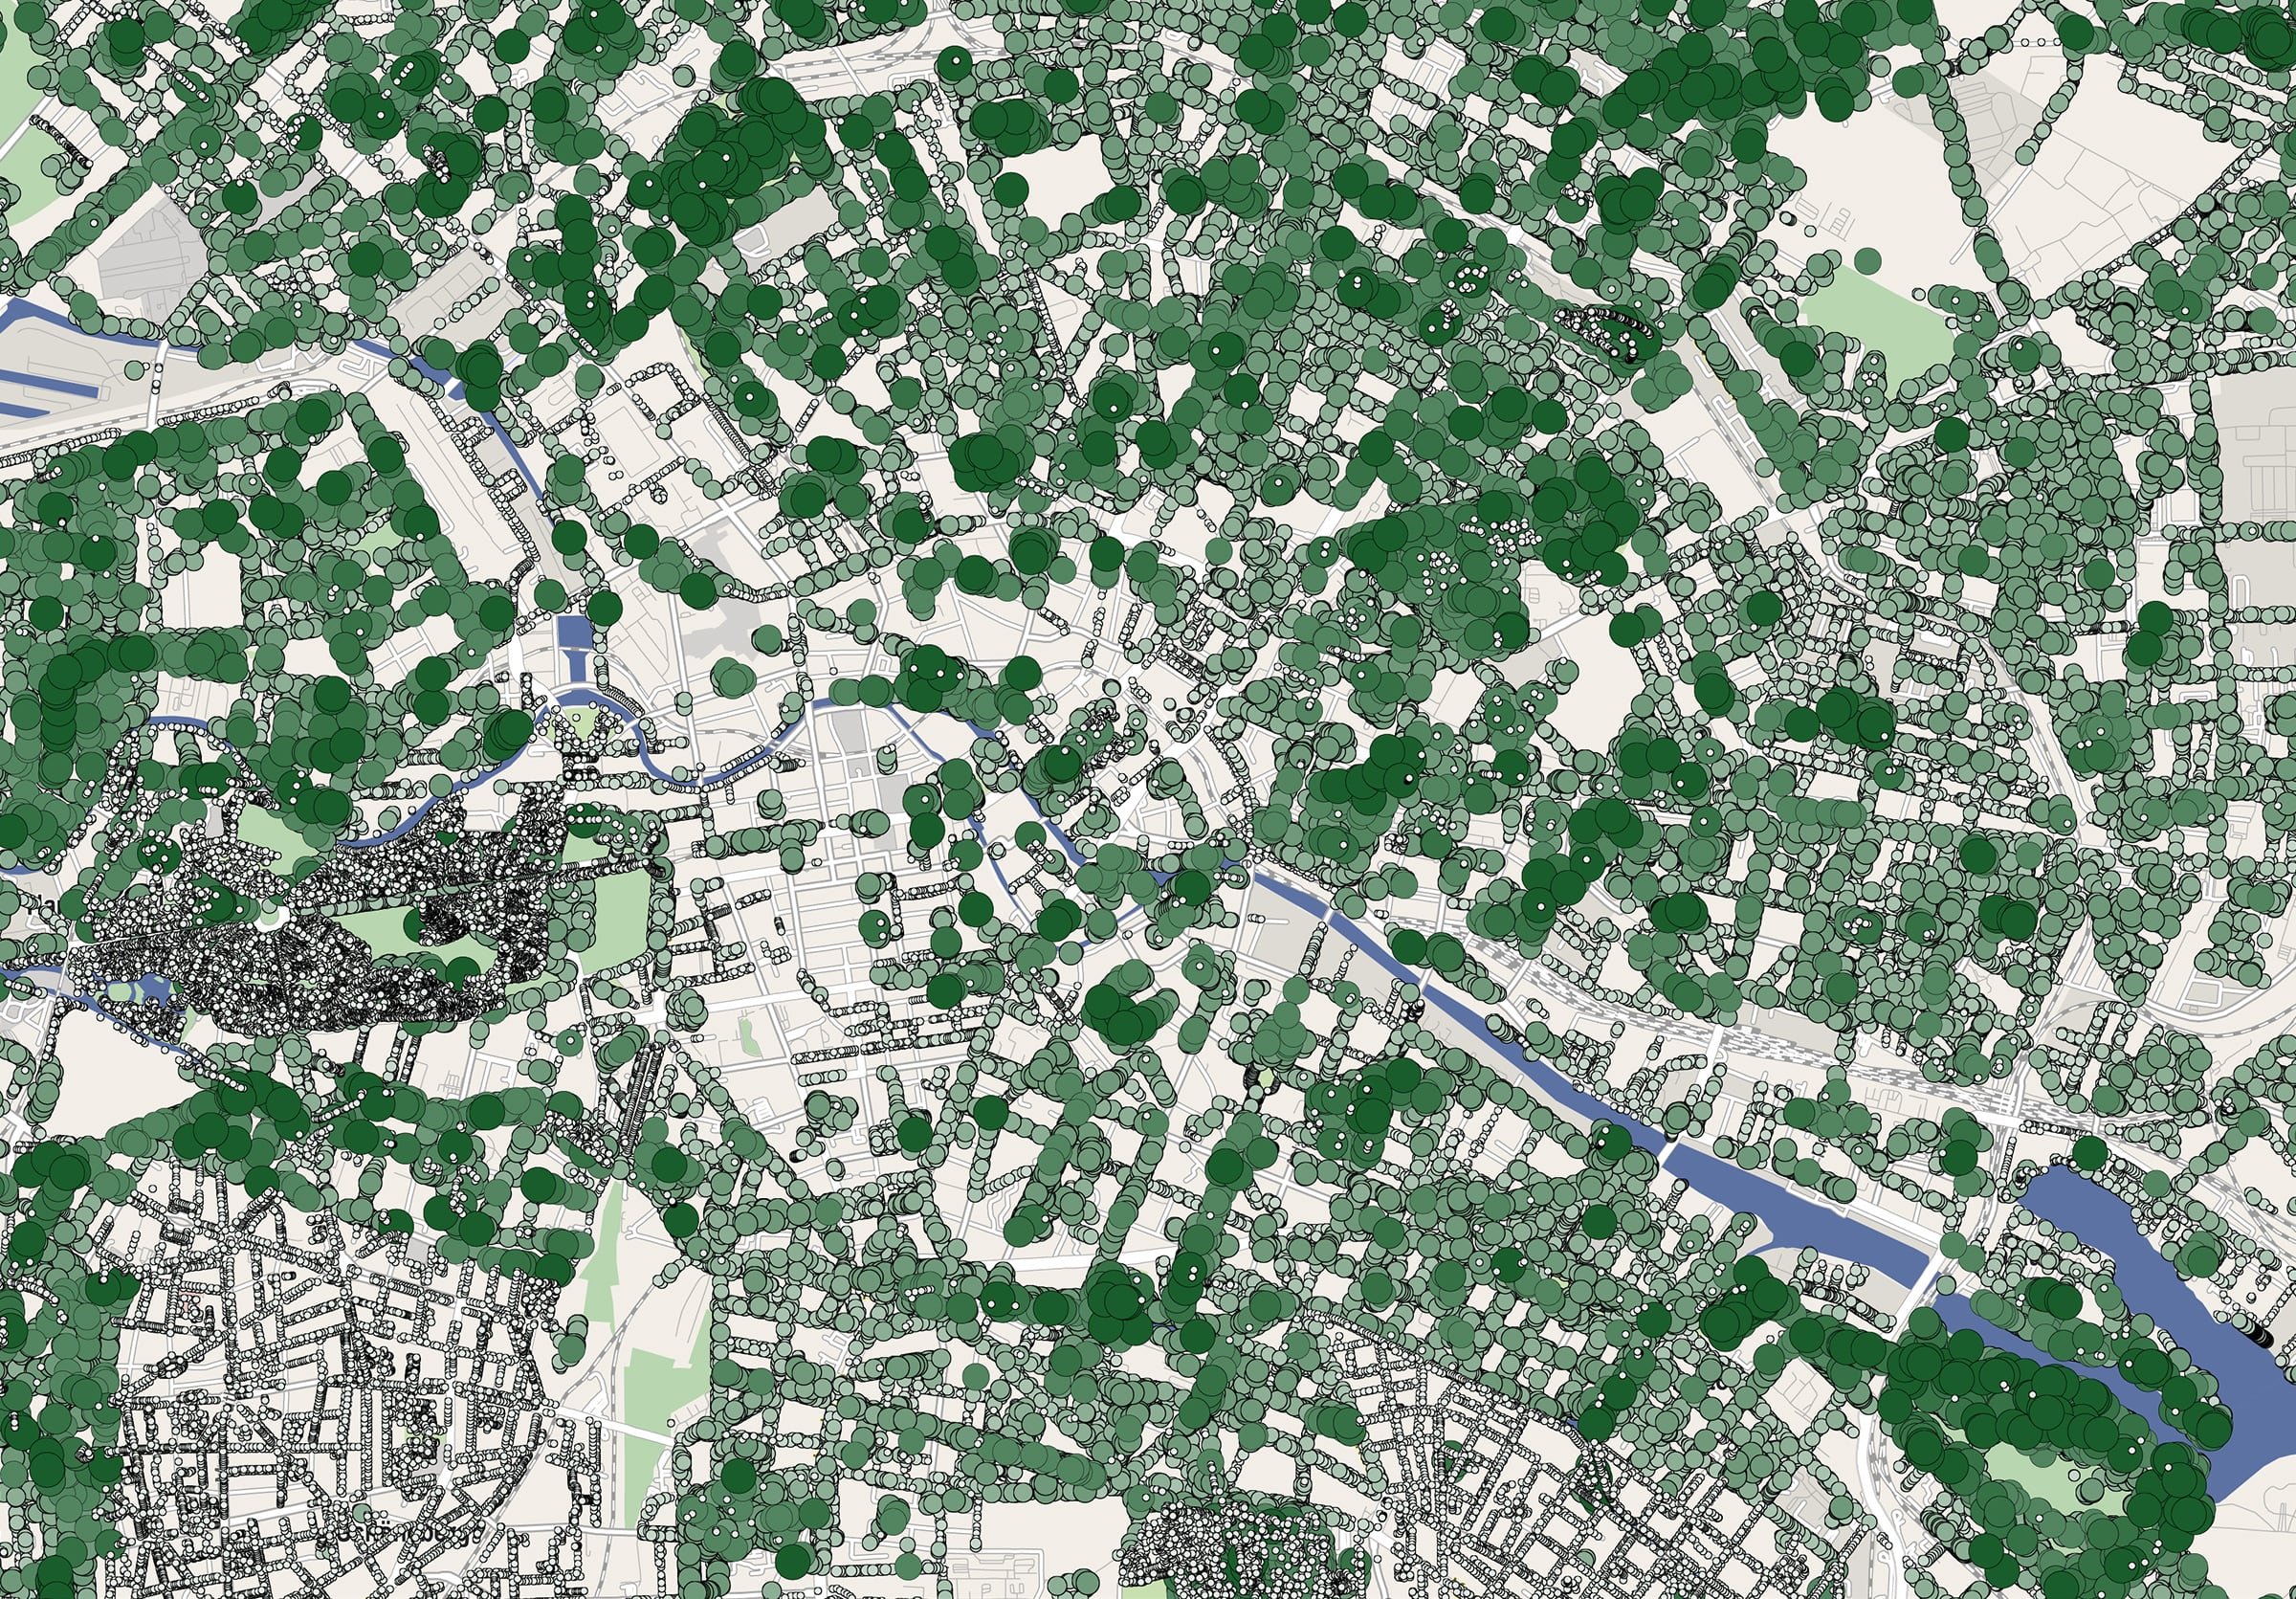
 not knownup to 3 mup to 6 mup to 9 mup to 12 mup to 15 mup to 18 mup to 21 mmore than 21 m
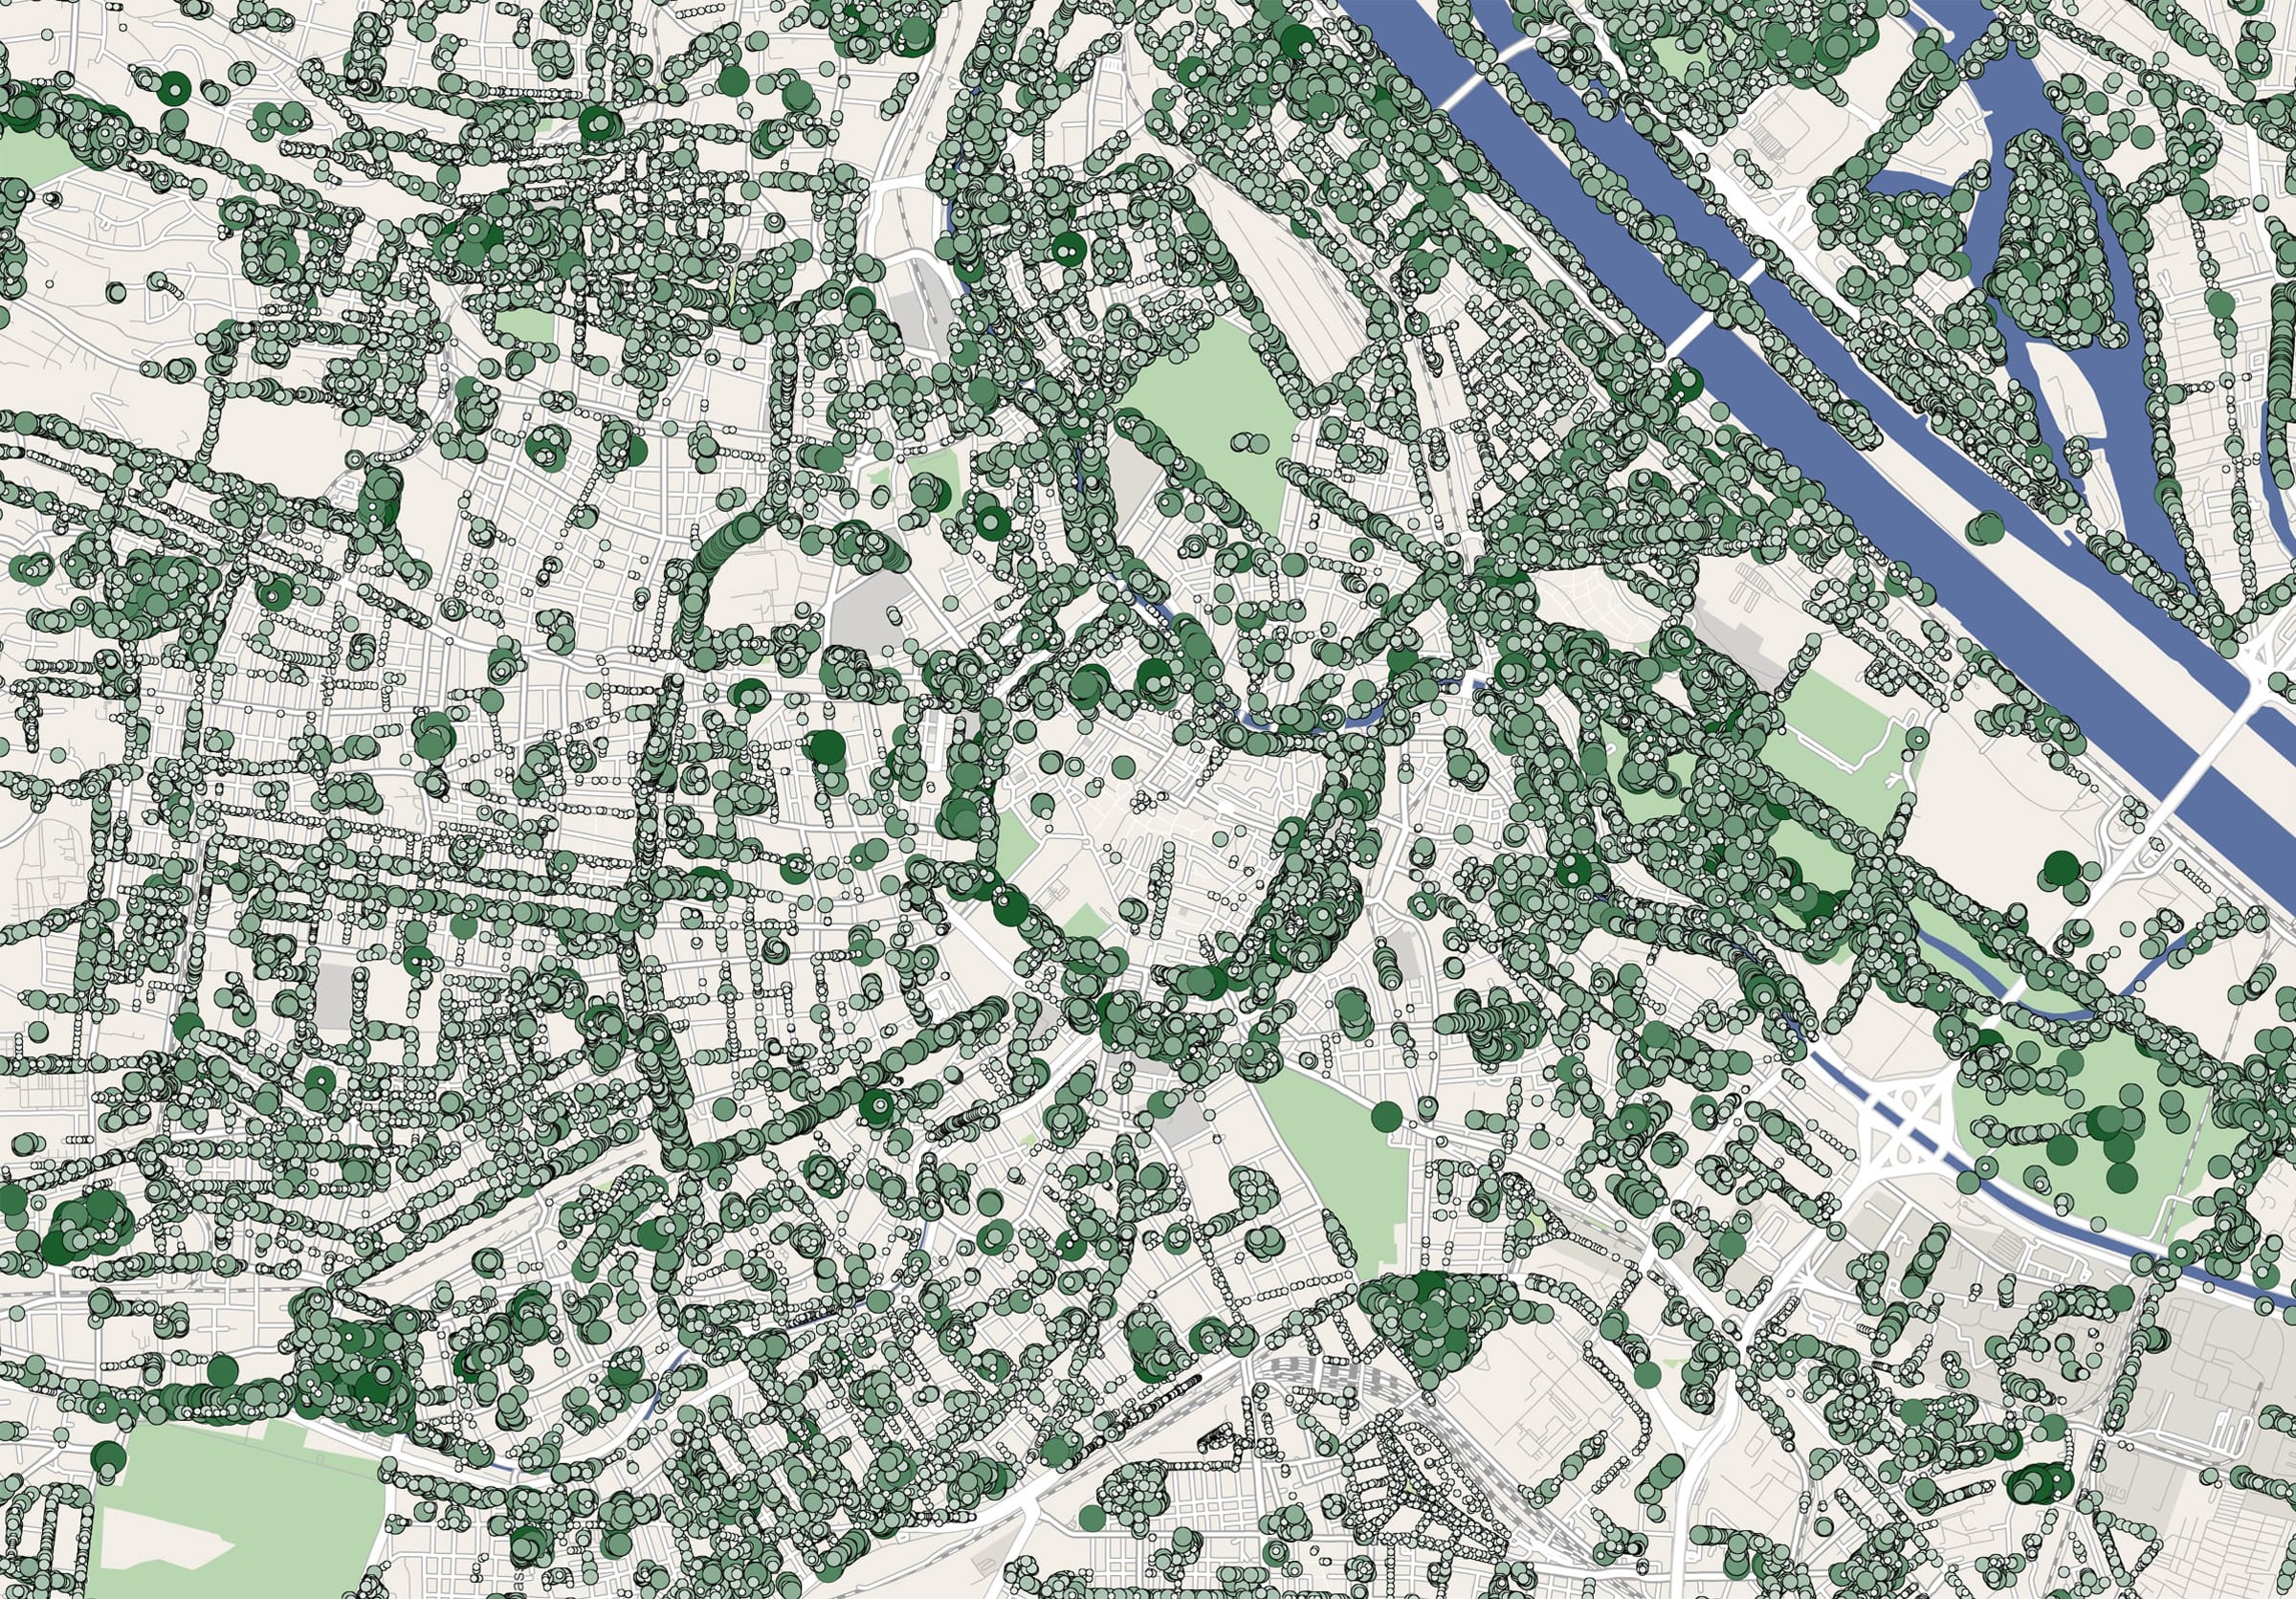

Germany aims to achieve carbon-neutral heating by 2045. In cities and municipalities with more than 100,000 inhabitants, a municipal heating plan must be in place by mid-2026 in order to determine the best and most cost-efficient way to achieve a climate-neutral heating supply. This should increase planning and investment security for building owners with regard to the existing or planned local heat supply.
District heating plays a crucial role in this, especially in urban areas. Across Germany, 14 percent of households are currently supplied with district heating, which has so far been predominantly (80 percent) from fossil fuels. While 30 percent of households in Eastern Germany are connected to a heating network, the figure in Western Germany is currently just under 10 percent. However, even in urban areas with district heating networks, connection is not always possible. The heating network areas in German cities are generally limited to inner-city locations and new developments. Within these supply areas, not all households are connected to the district heating network.
In light of long planning periods, potential connection obligations and cost factors such as the CO2 tax, consideration of municipal heating plans will play an increasingly important role in real estate investments, project developments and energy-efficient refurbishments.
Map description: The map shows the existing and planned district heating network areas in Düsseldorf, Hamburg, Munich and Stuttgart. Additionally, the existing district heating connections were evaluated based on the 2022 census. The black squares correspond to an area of one hectare on which at least five connections were declared.
 Existing connections (at least 5 per ha)
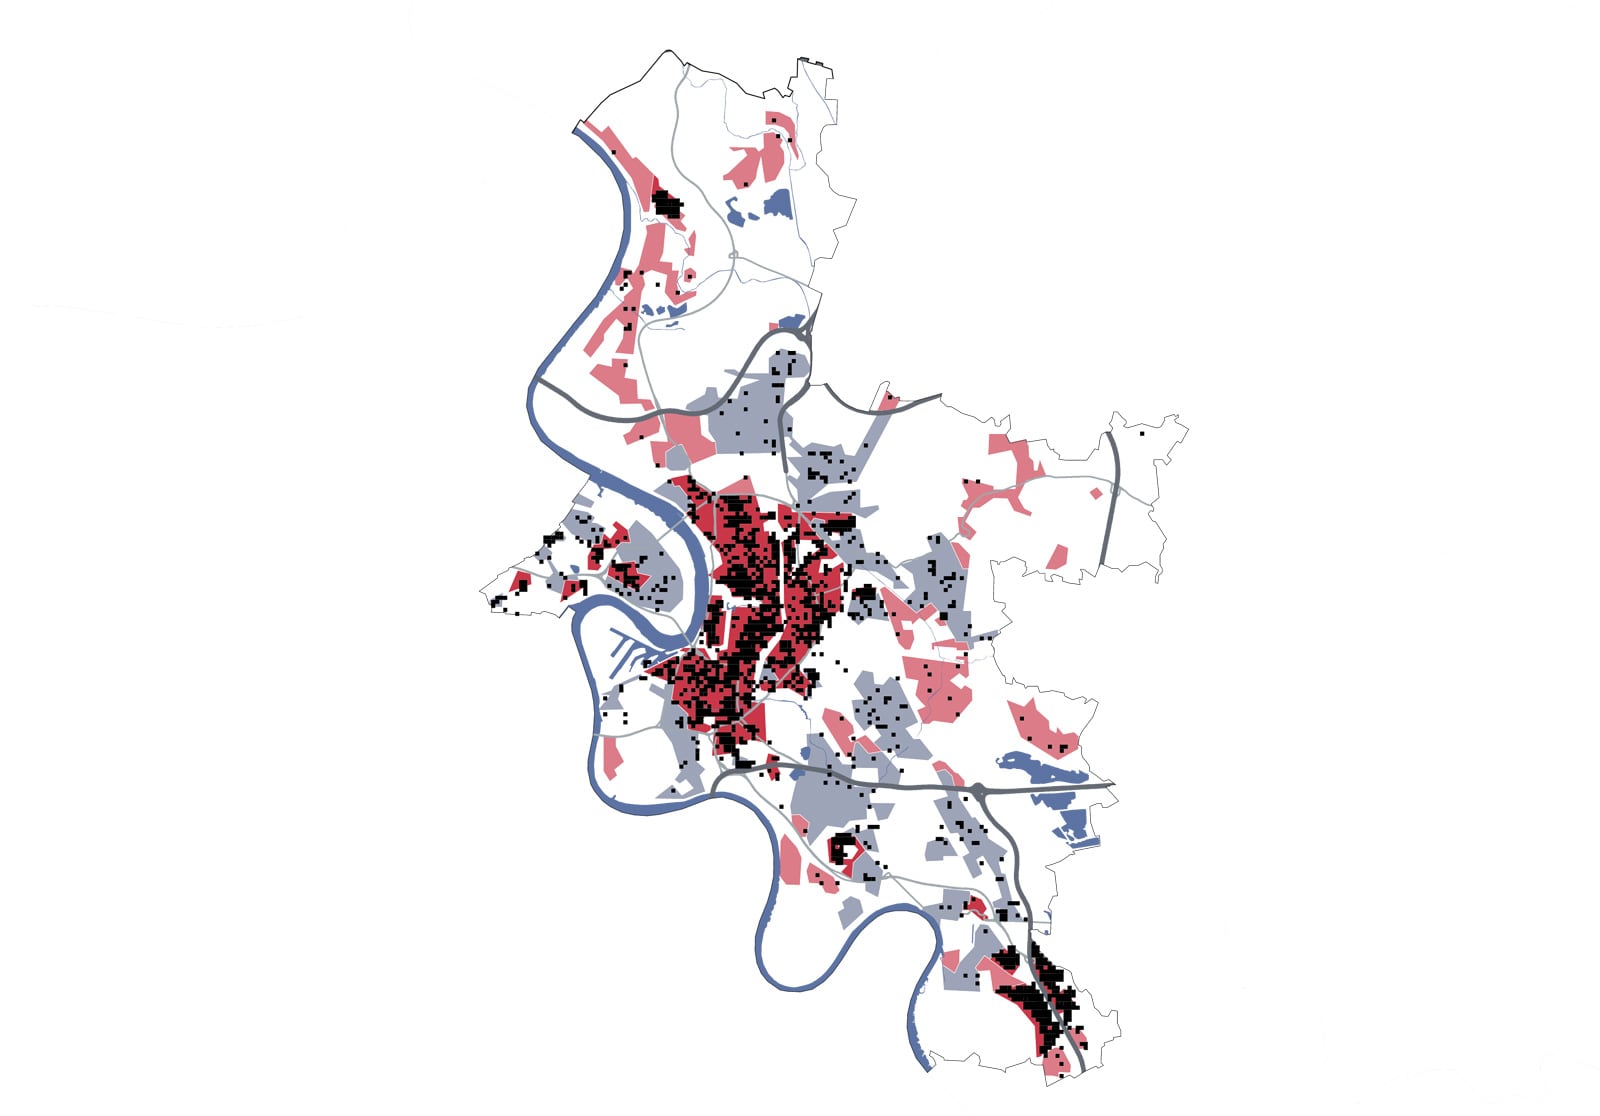 Existing connections (at least 5 per ha)
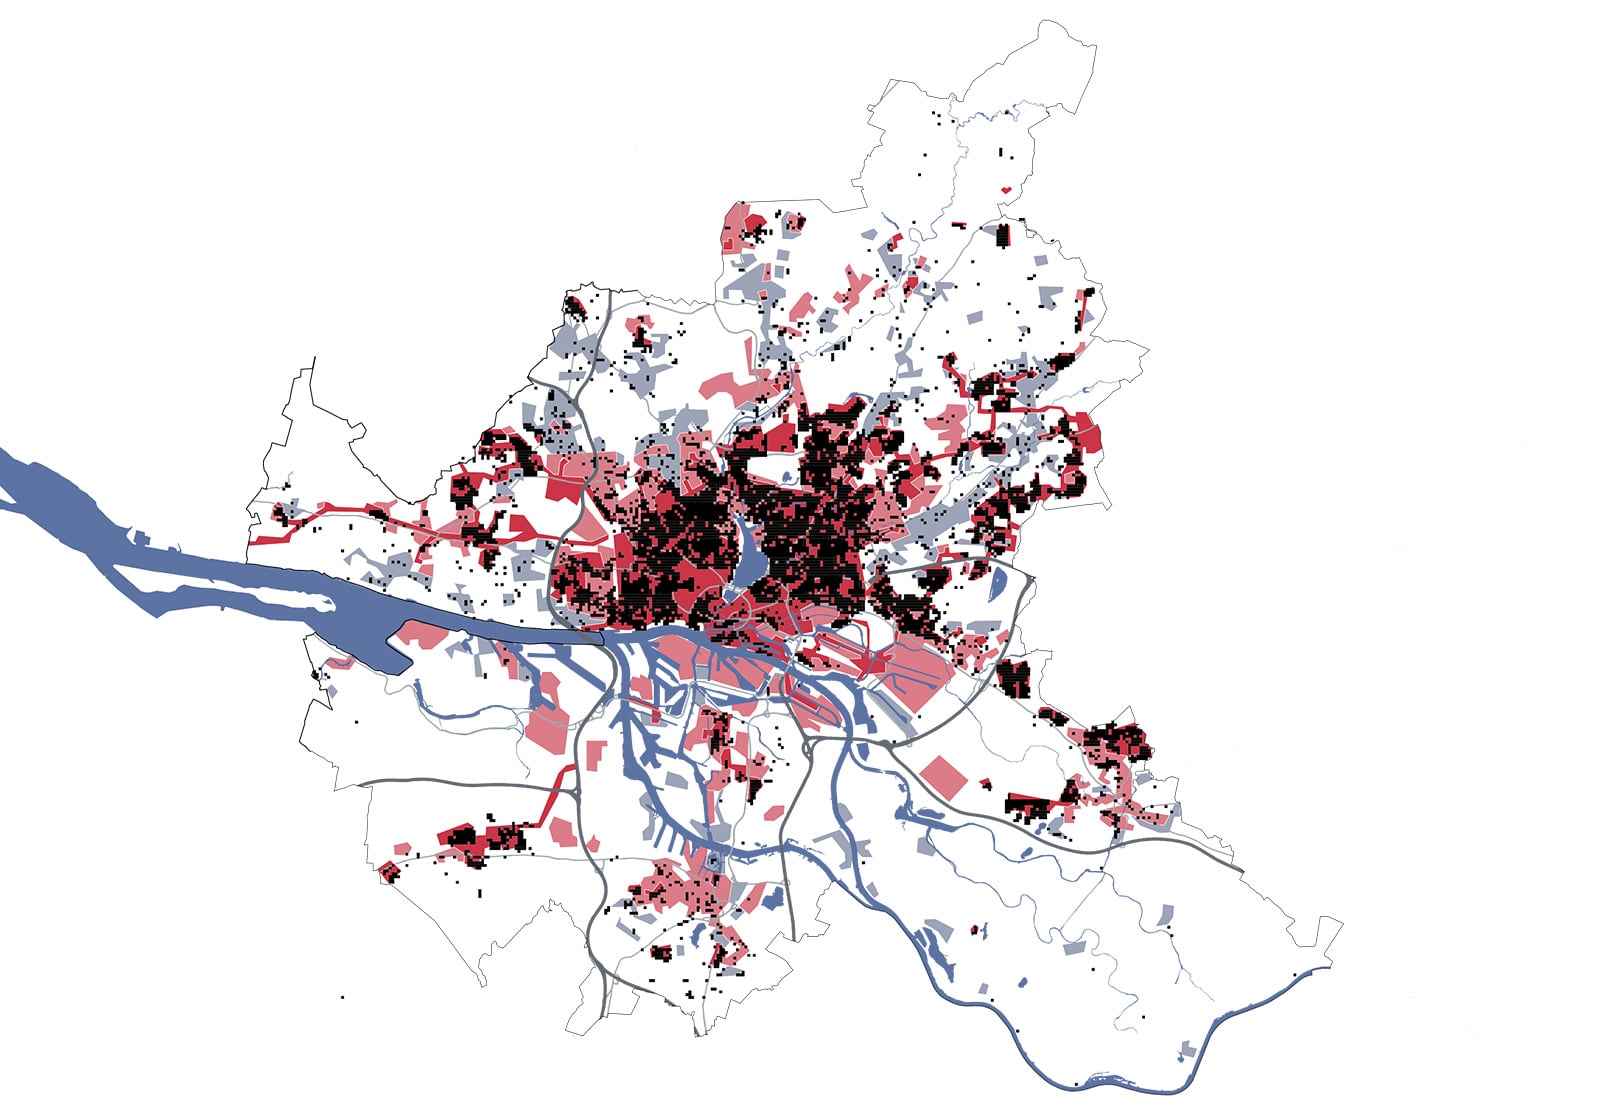 Existing connections (at least 5 per ha)
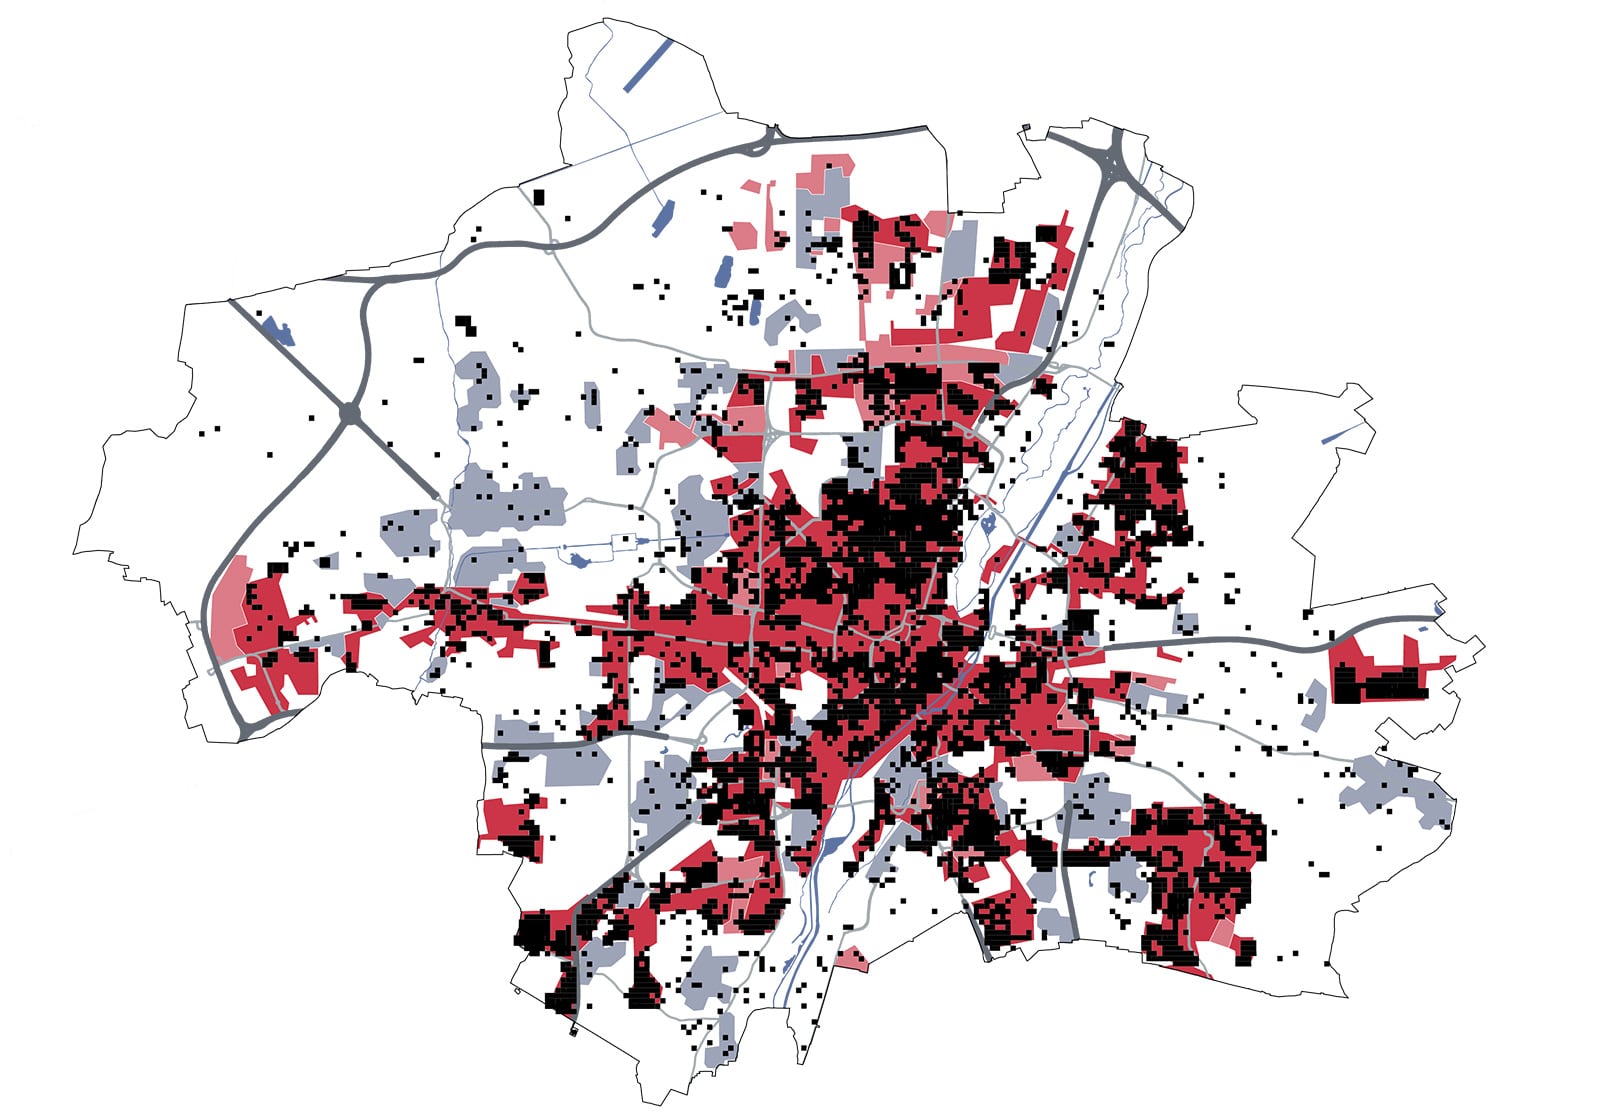 Existing connections (at least 5 per ha)
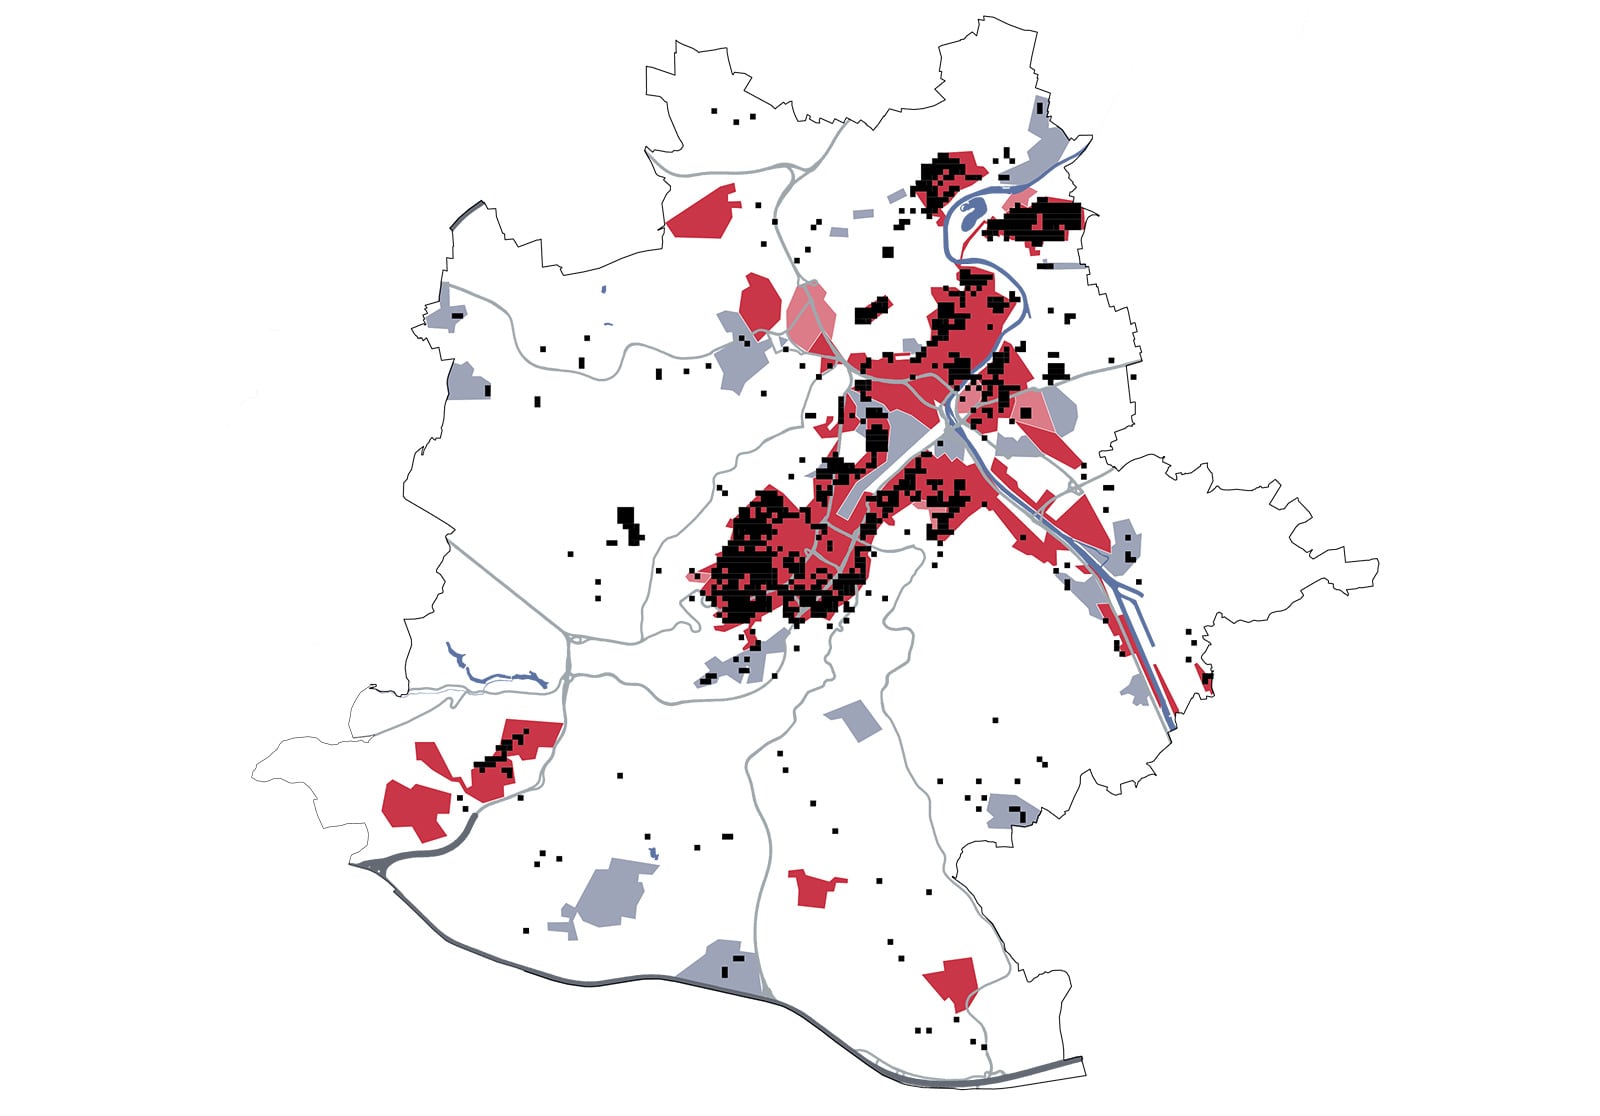

"A good city is like a good party – people stay longer than really necessary because they are enjoying themselves." — Jan Gehl
The mobility needs of the networked knowledge society remain high and will likely continue to increase in the future. The requirements for the mobility of tomorrow are diverse: it should be multimodal, available around the clock, flexible, shared, seamlessly available, and at the same time resource-saving and climate-neutral. Users are at the core of "mobility as a service". Residential buildings and places of work are elementary components as starting and destination points for a large proportion of the journeys made, and can gain competitive advantages with suitable mobility concepts.
Some cities are particularly attractive to young people because, in addition to economic strength and modern mobility concepts, they also offer a vibrant nightlife.
One of the biggest challenges in electrifying road transport is the limited availability of charging stations. Currently, an average of 22 electric cars share one public charging point in Germany – in the Netherlands, the figure is only four. Not only the number of charging points but also their location is crucial for a comprehensive and sustainable charging infrastructure. Across Germany, the nearest public charging station is around a seven-minute drive away, and the nearest fast-charging station is an average of around 12 minutes away. Coverage in urban areas is far better than in rural areas. Ideally, an electric car can be charged during working hours, while shopping, or close to home. However, it is crucial that charging points are available within walking distance. This consideration reveals a less comprehensive picture, even in major cities such as Hamburg and Cologne. Only seven percent of apartment buildings in German city centres offer their residents private charging points or charging stations.
In addition to e-mobility, shared services such as car sharing and e-scooters are becoming an increasingly important component of urban mobility concepts in particular. As a result of the consolidation of the shared mobility market, there are fewer and fewer large providers active throughout Germany and Europe. Areas of business on the outskirts of cities are still shrinking due to insufficient demand. Increasing demand for real estate and densification, including in more peripheral locations, could also lead to a regional expansion of services in the future.
Over 90 percent of all journeys start or end at home or the workplace. Micro-locations with a diverse range of different alternative means of transport are becoming increasingly relevant both in the choice of where to live and in the choice of where companies are located. With new, user-centered mobility concepts, living and working locations can be particularly attractive for the multimodal, young, urban clientele.
Map description: The blue shading shows where a public charging station can be reached on foot within five minutes. The yellow and orange areas are the business regions of car sharing provider Share Now and e-scooter service Dott (formerly Tier).
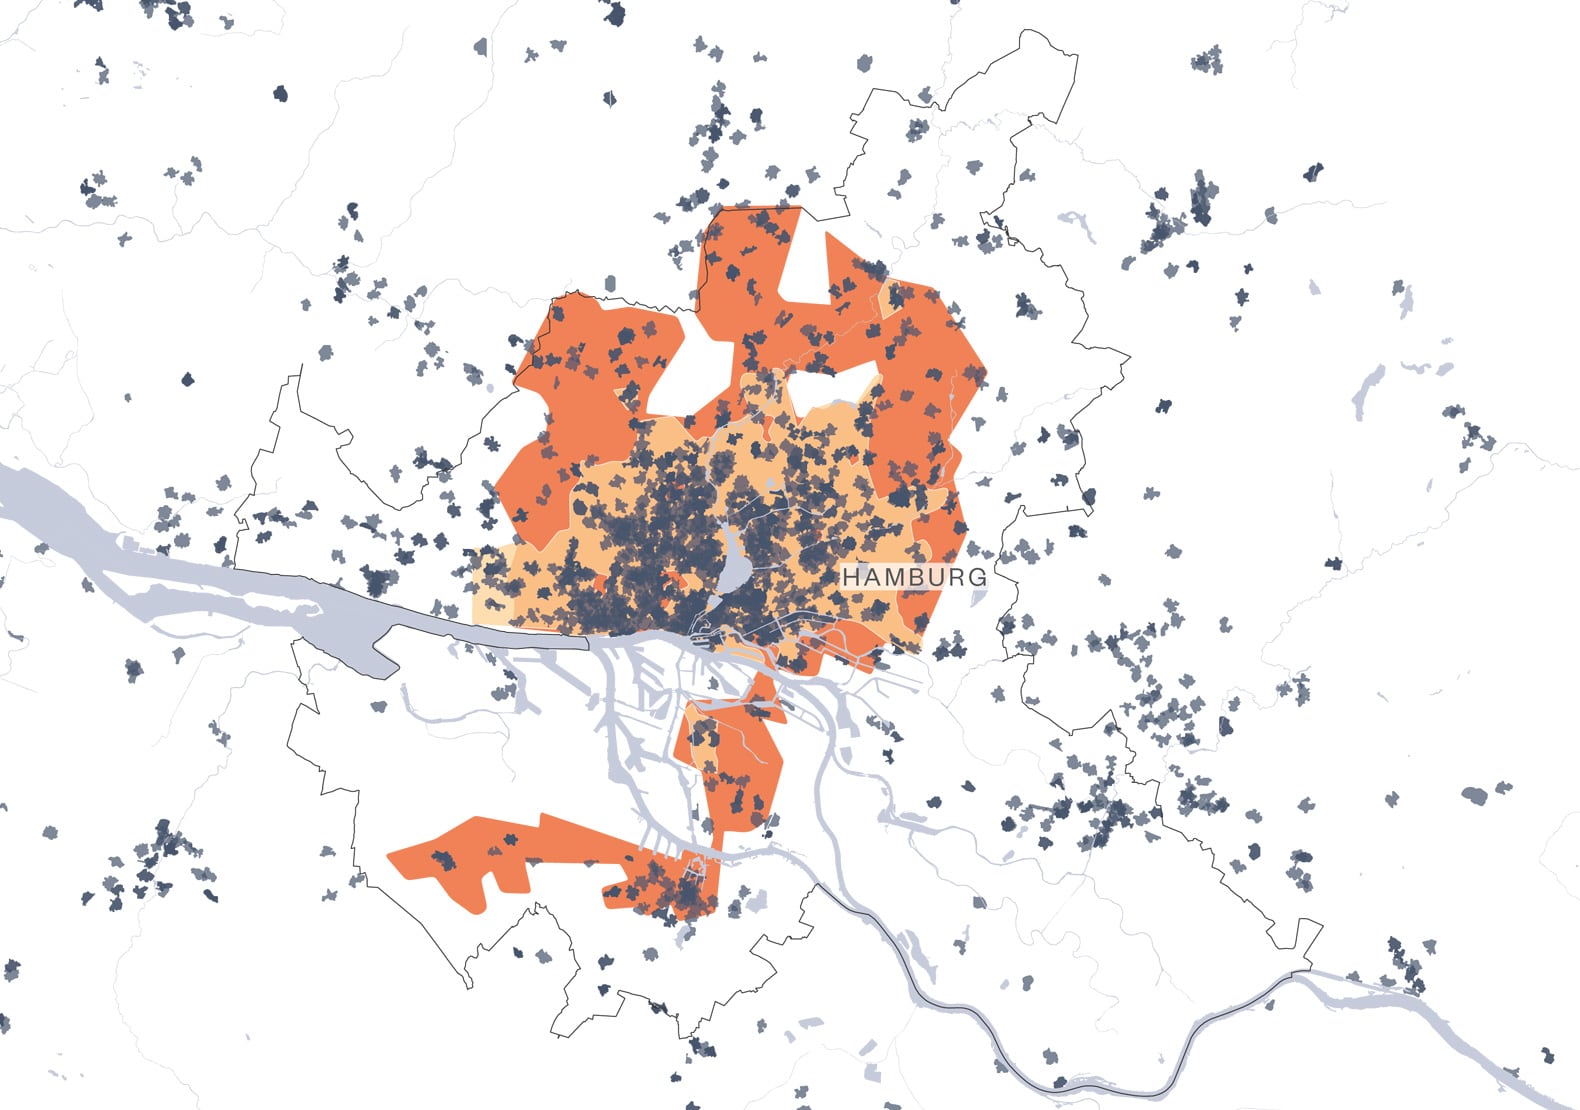
Cities are, right around the clock, the economic, social and cultural centres of our networked world. Major cities such as Berlin, Hamburg and Munich have vibrant, contrasting and hip urban landscapes that make them desirable places to live and work. An attractive nightlife with restaurants, bars and entertainment facilities such as theaters, live music venues and nightclubs is also a location factor that should not be overlooked. Taking these intangible factors into account can help to better assess the attractiveness and appeal of cities to young people.
Analysis of movement patterns using mobile phone data is a suitable method for identifying nightlife hotspots and the nocturnal dynamics of cities. The resulting spatial patterns show which parts of the city are also lively at night – especially nightlife districts such as Hamburg’s Reeperbahn, trendy districts such as Berlin’s Neukölln, and major transport hubs. On the other hand, it is possible to identify which parts of the city are truly quiet at night. The latter tend to be quieter residential areas and appeal to a different clientele than the urban nightlife hotspots. Expanding location analyses to include nightlife can help make real estate investments and developments more targeted and marketable to specific audiences.
Map description: The map visualises the total sum of mobile phone movements on Friday and Saturday night between 2 a.m. and 3 a.m. in 2022. Anonymised and aggregated mobile phone data from the Telefónica GmbH network were analysed for this purpose. The grid cells shown (500x500 meters) are shaded according to the total number of mobile devices there for at least 30 minutes during the observation period. Additionally, bars are marked as white dots.
 Bars
Bars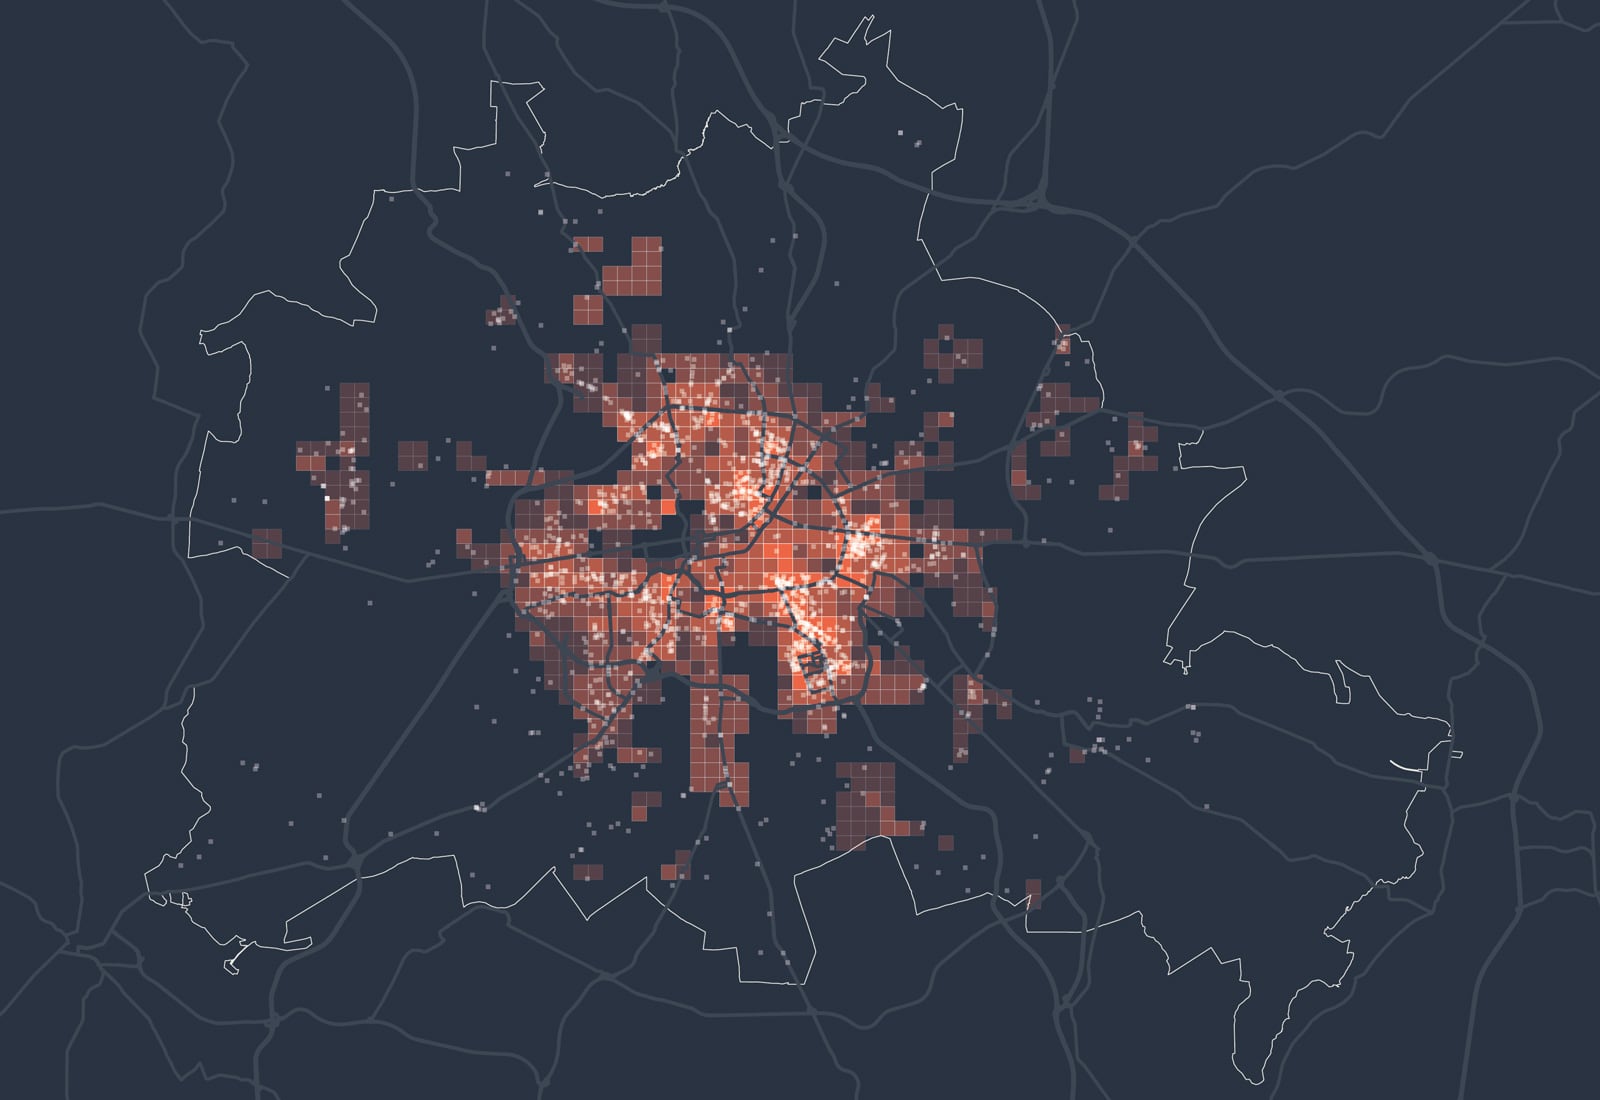 Bars
Bars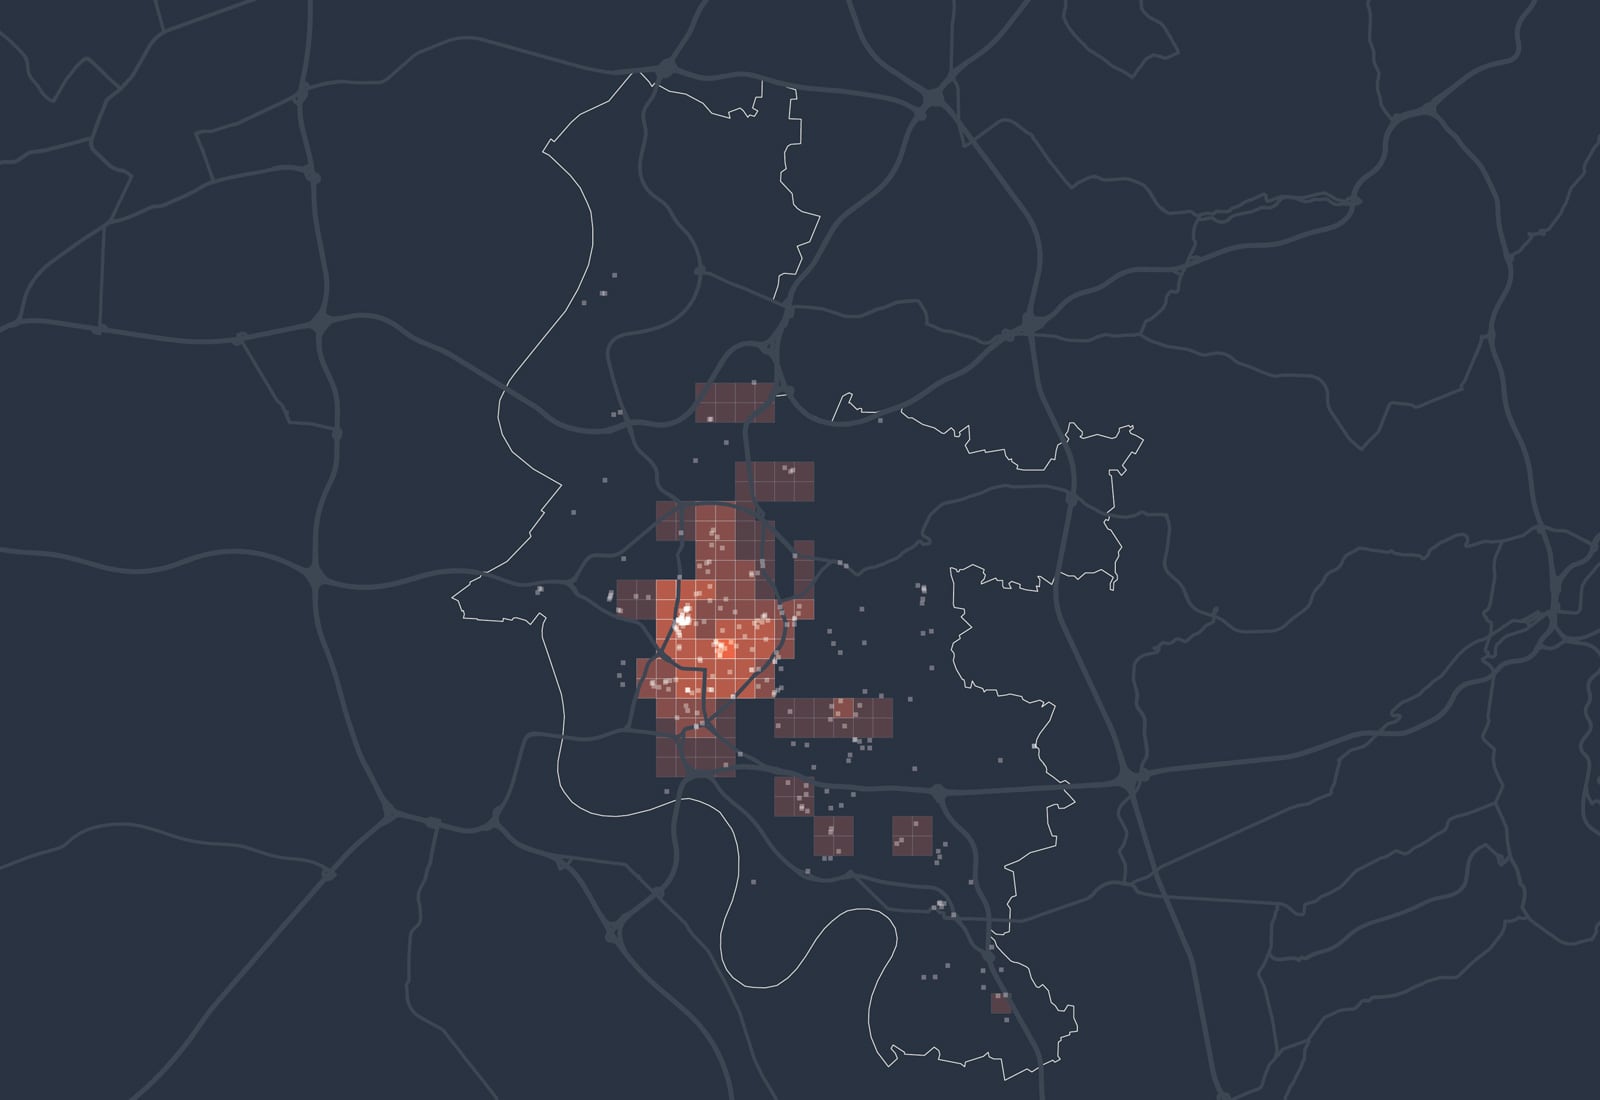 Bars
Bars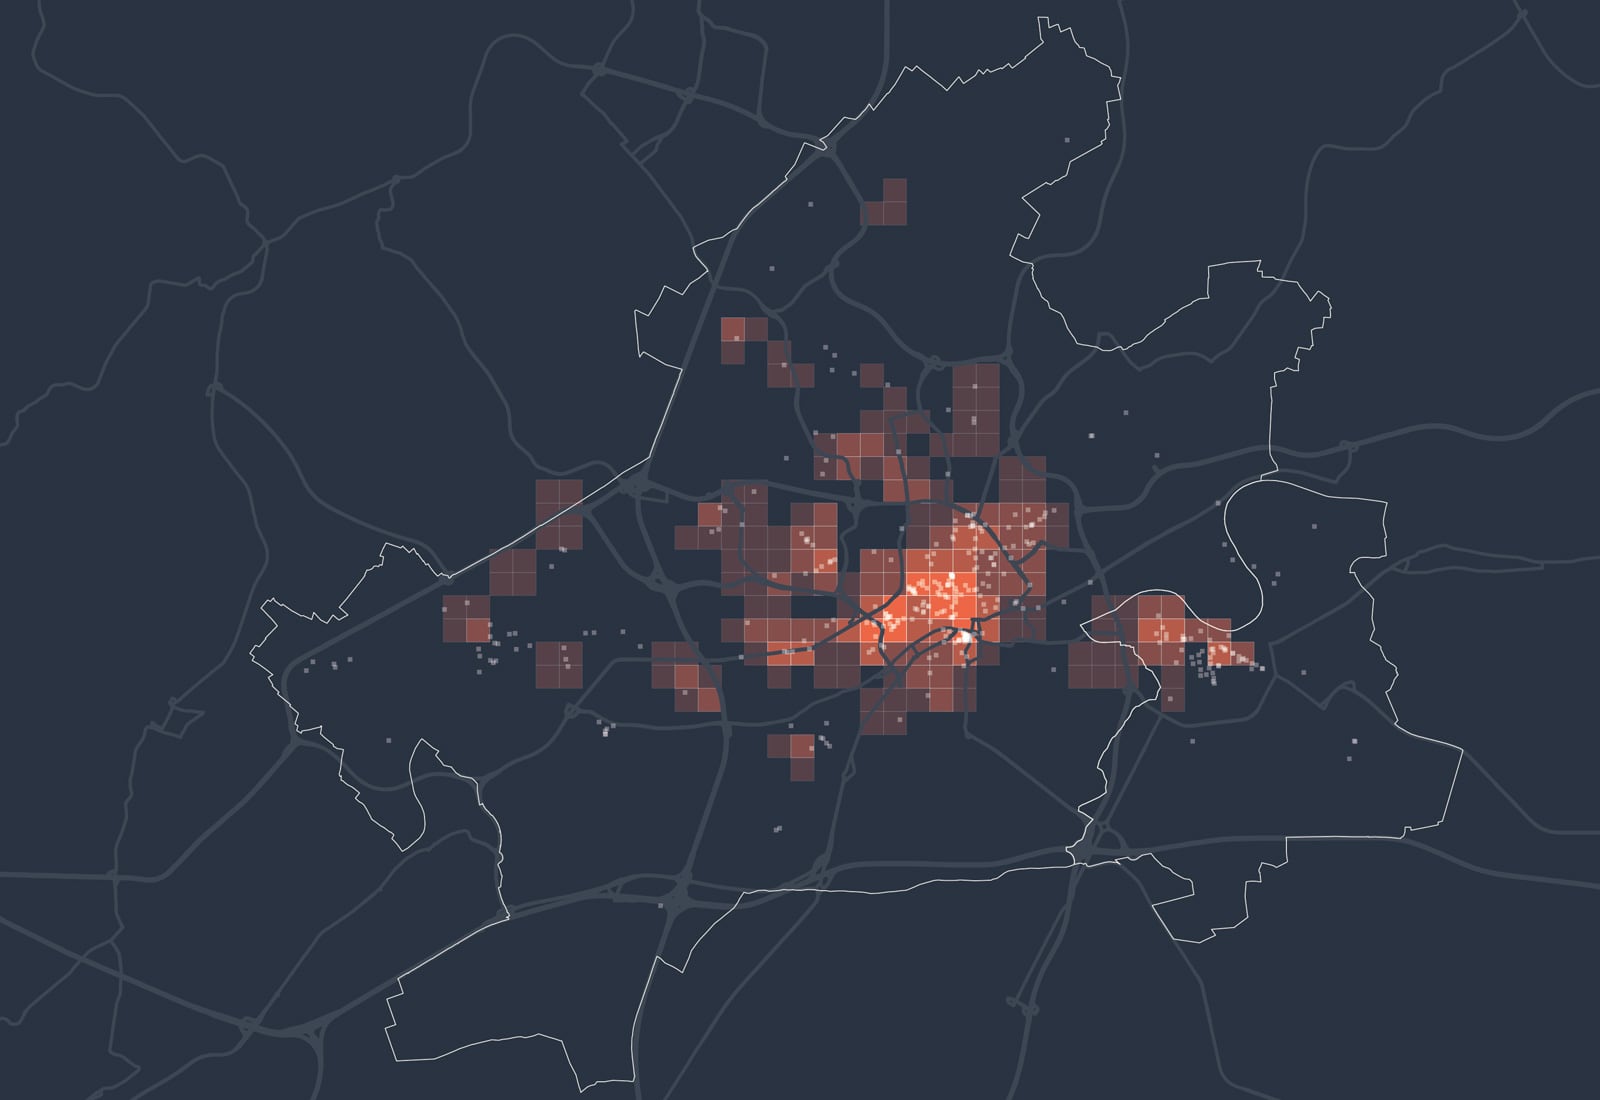 Bars
Bars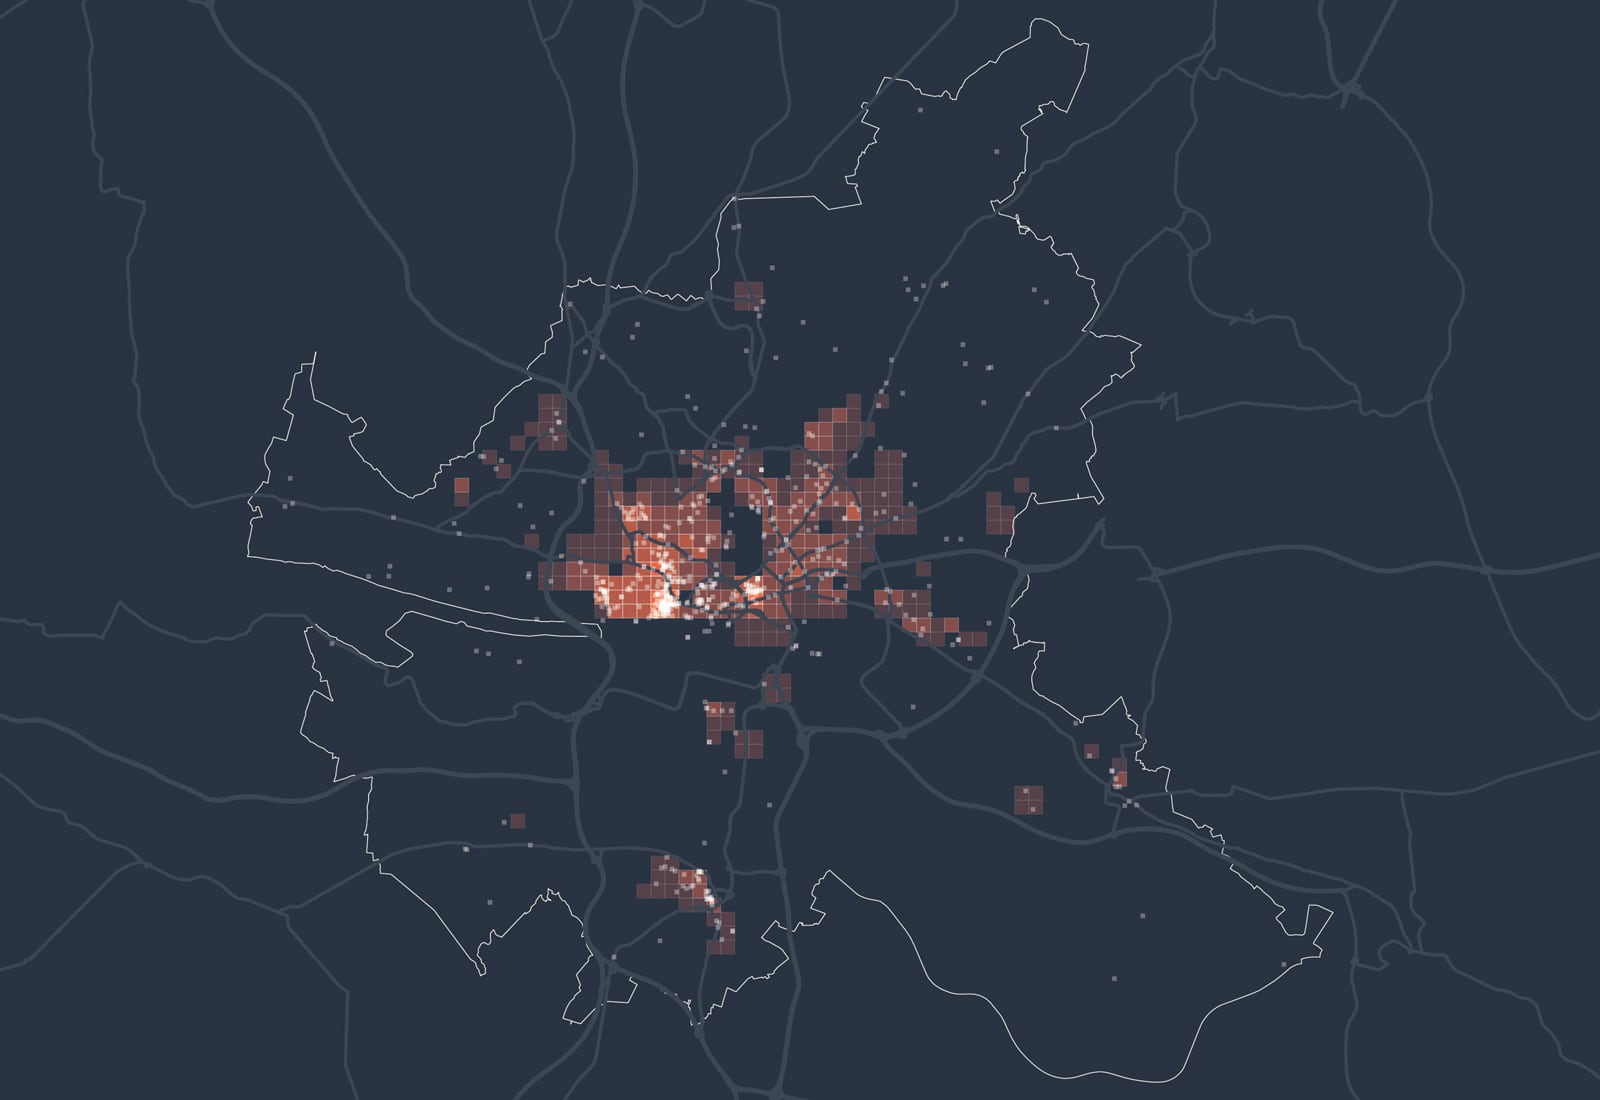 Bars
Bars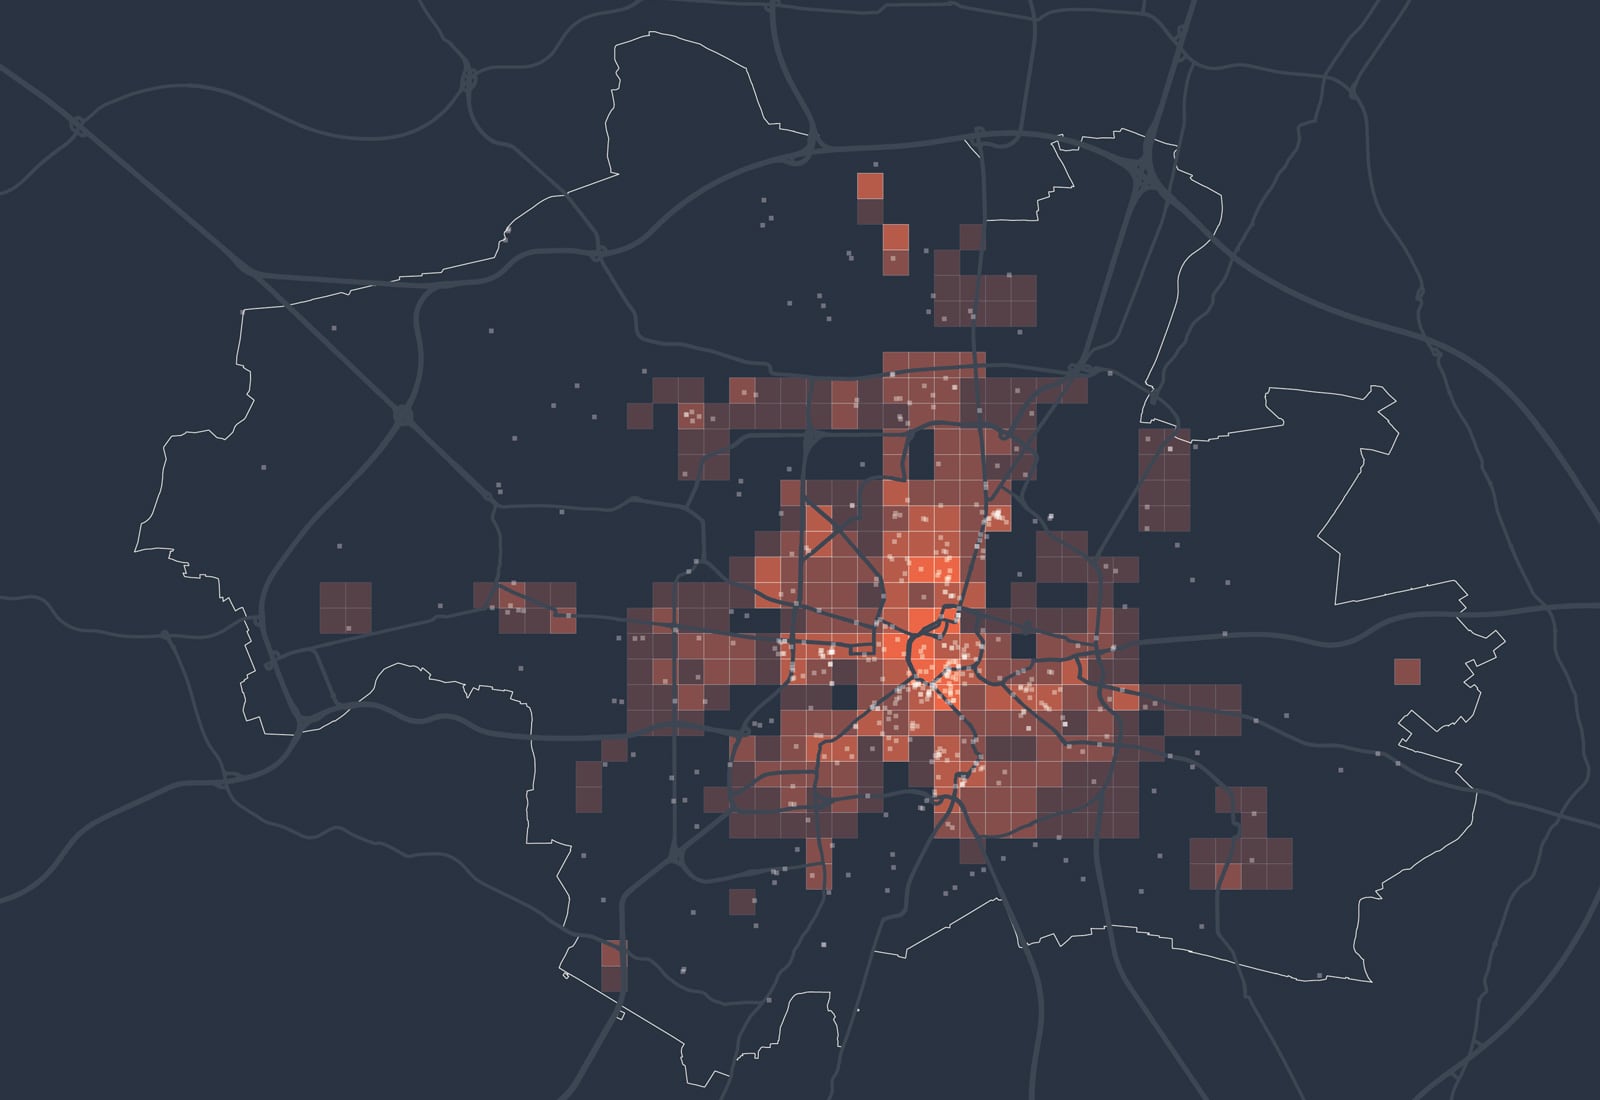 Bars
Bars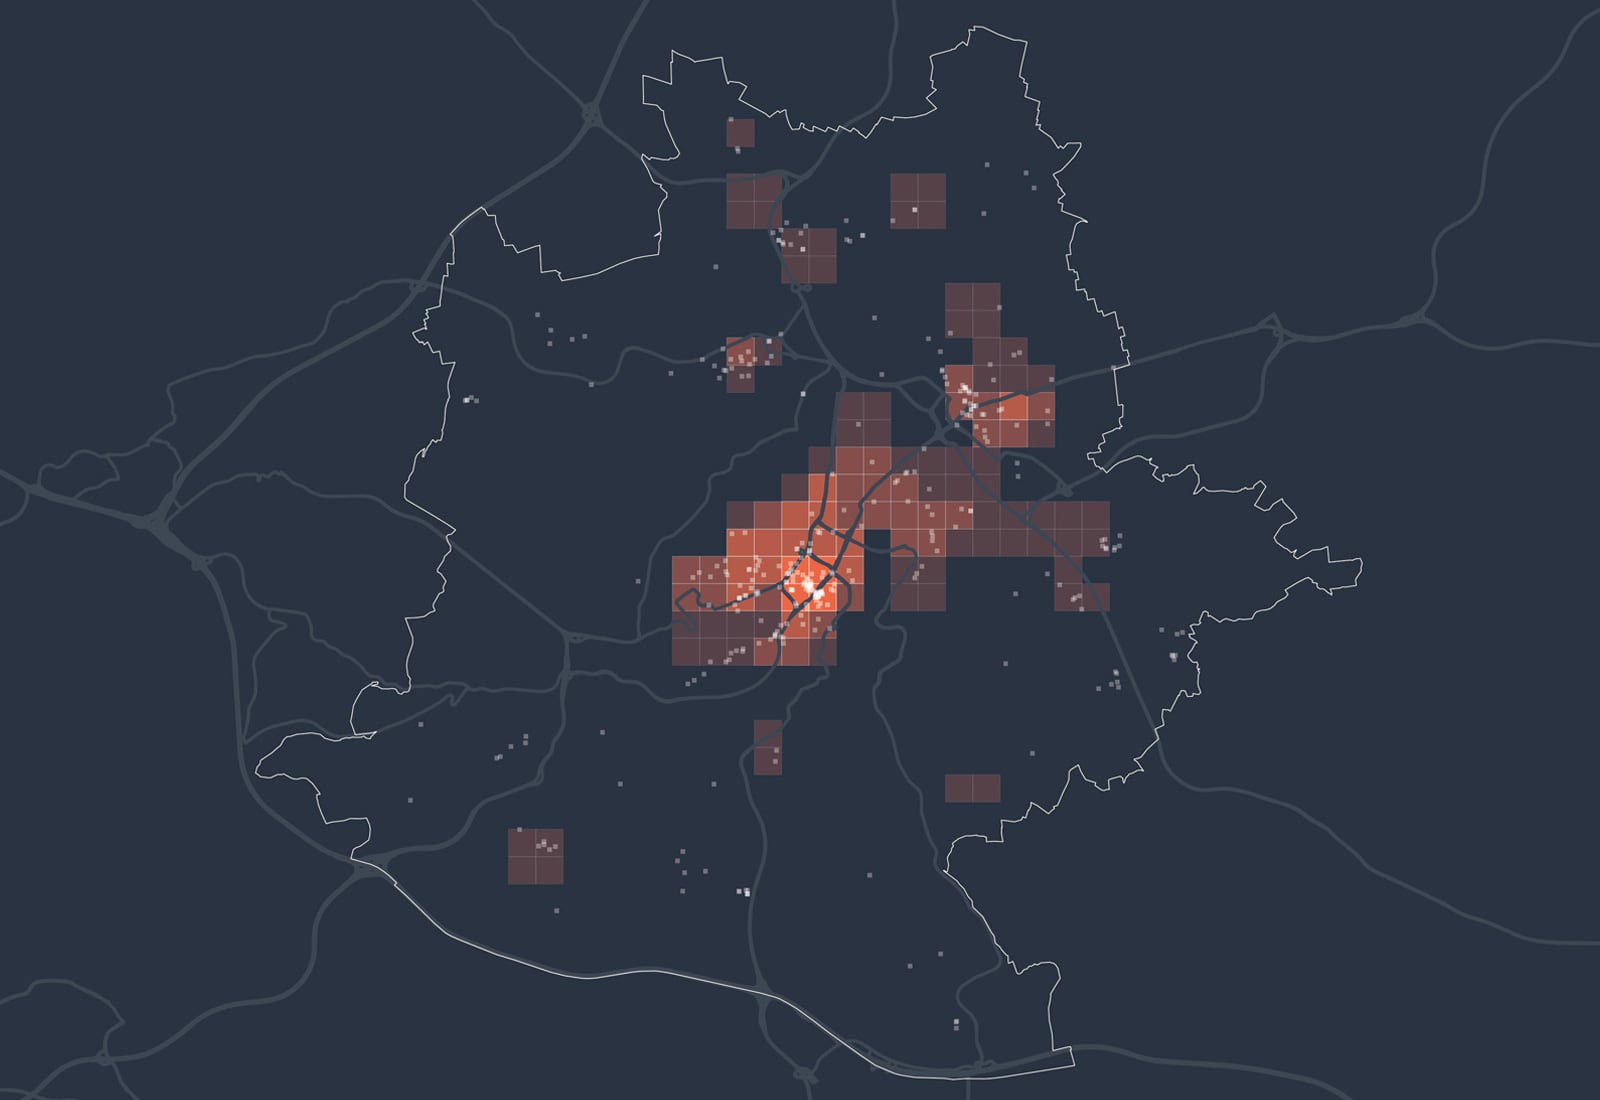

"Städte müssen Orte sein, die nicht nur wirtschaftliches Wachstum fördern, sondern auch soziale Gleichheit und Gerechtigkeit sichern." — David Harvey
Ensuring a good supply of housing is considered a basic social need and an indispensable anchor of stability for society. Especially in large cities and metropolitan regions with strained residential markets, asking rents have shifted significantly towards the upper price segment in recent years. The (de-)regulation of rent prices, investments in subsidised housing and the reduction of bureaucracy in construction law are therefore key themes in the current election programmes for the upcoming German federal elections. In the real estate industry, social issues are becoming increasingly apparent in the debate around affordability and the creation of affordable housing.
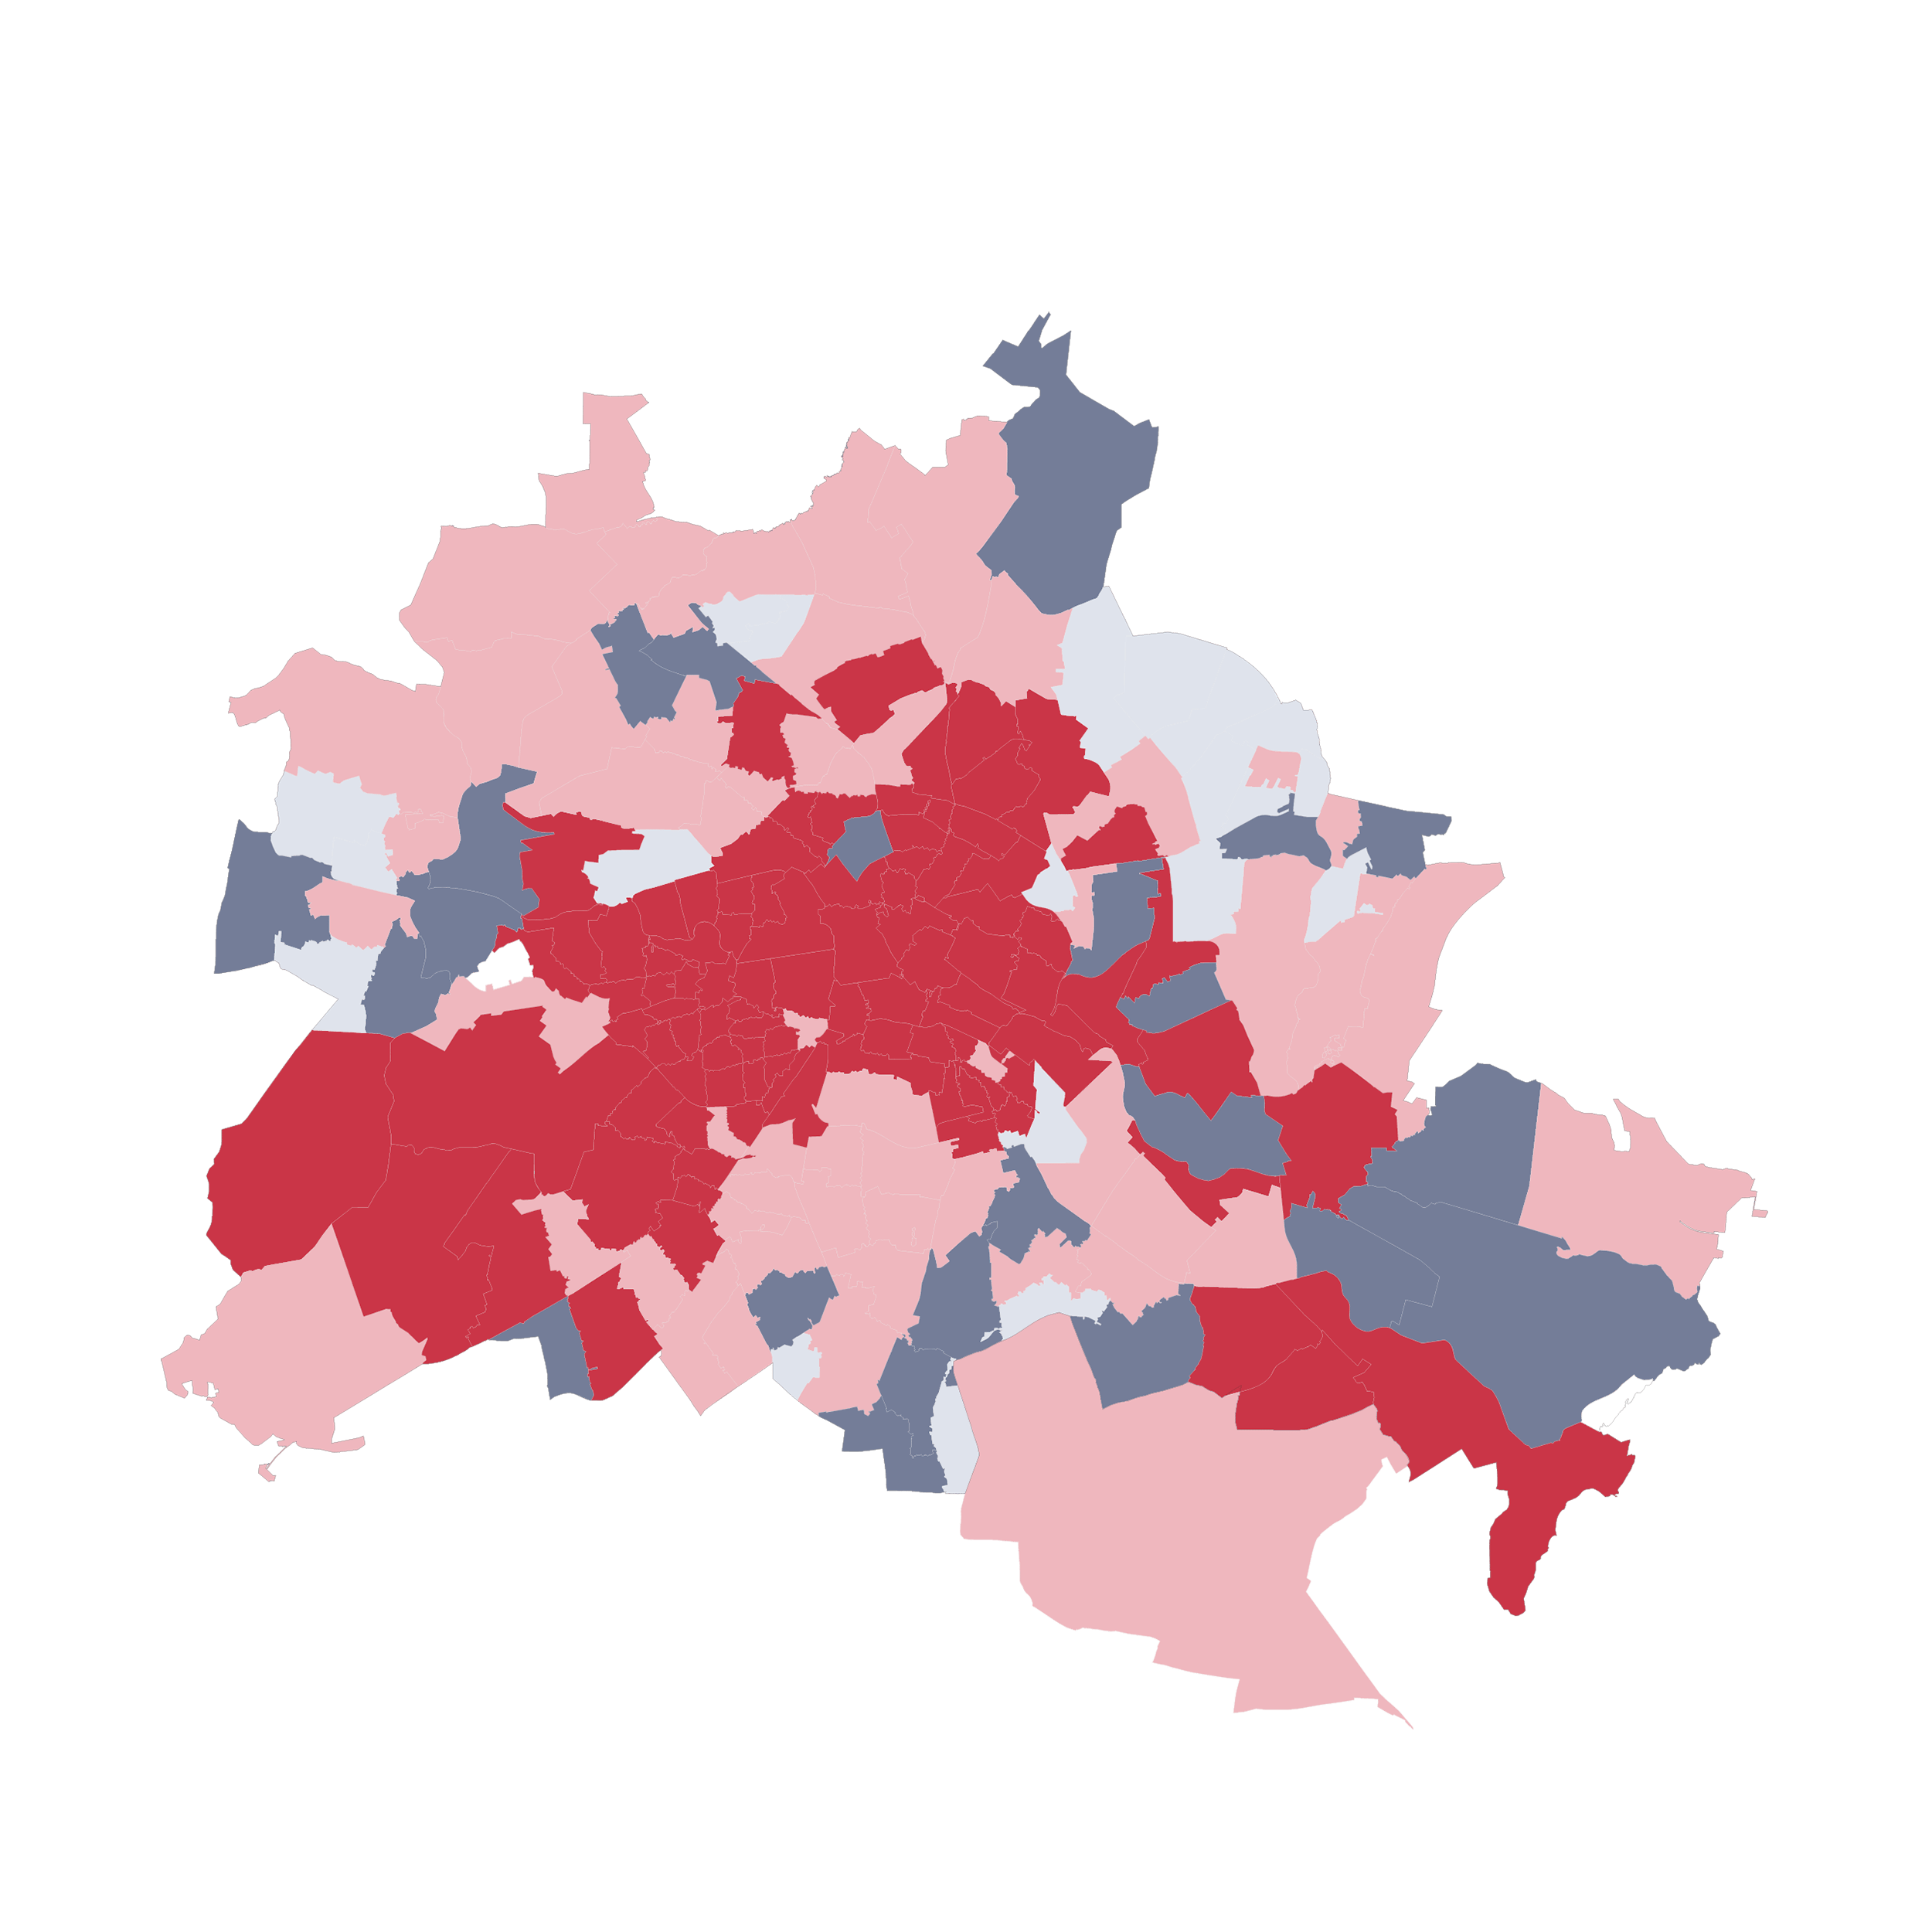
Rising rents and the growing shortage of affordable housing are opening up debates about excessive and rising rental costs, especially in large cities. From a social policy perspective, a rental cost burden of more than 33 percent of net household income exceeds the affordability threshold and the corresponding apartments are therefore too expensive in relation to income.
It is predominantly the attractive urban districts that are the preferred target of demand and where, especially when looking at new leases, above-average rent burdens are often clearly noticeable. Looking at different income classes and household types (single-person households, DINKs, families), however, there are major differences: low-income earners and those living alone are most affected by high burdens, while households with higher incomes or dual-income households have significantly lower burden rates. This kind of differentiated analysis of rental burdens is essential for the housing sector in order to be able to estimate future potential for rent increases depending on the location, and to define and quantify possible target groups.
Map description: The maps show the average rent burden ratio for new rentals for the individual postal code areas. The ratio is based on the quoted rents in the respective postal code area and the net household income. Net household income has been calculated on the basis of the gross pay of full-time employees subject to social insurance contributions (as of 2024) in the respective cities, differentiated by quantile. In Berlin, the net income of single-person households in the first quantile is around €2,040/month, the median is €2,590/month and the third quantile is €3,450/month. For DINK households (two people, two incomes), the gross pay is doubled accordingly. For families, a full and a half gross salary is applied, and an additional 500 euros in child benefit is included in the net salary. The average dwelling size of 1-person, 2-person and 4-person households from the microcensus is used as the dwelling size.
The German rental housing market is made up of various groups of providers. By far the largest group of landlords is private individuals (around two thirds of rental housing in Germany), who usually only rent out a small number of apartments. Then there are professional landlords who operate in the market with different organisational structures and goals: municipal providers (around 2.7 million apartments across Germany), cooperatives (around 2.2 million apartments) and private-sector housing companies (around 2.7 million apartments).
In North Rhine-Westphalia, around 280,000 apartments are in municipal hands. Municipal housing companies play an especially significant role in housing policy. This is because they have the task of providing housing for low and middle-income households in particular. Accordingly, almost a quarter of the municipal housing stock is subject to rent control or occupancy obligations. However, the average rents of the vacant housing stock are also well below the average local rents. The municipal housing stock in Cologne is especially large, with over 55,000 apartments (mainly GAG Immobilien AG), around 13 percent of the total rental housing supply.
The cooperatives, on the other hand, vary greatly in size. While Spar- und Bauverein eG Dortmund, the number one in North Rhine-Westphalia, owns more than 11,600 apartments, more than 70 percent of cooperatives have fewer than 2,000 units. Cooperatives generally offer comparatively low rents, whereby they have increasingly imposed a freeze on acceptance of new tenants due to the shortage of supply, particularly in metropolitan areas.
A significant proportion of the portfolios of private-sector housing companies is located in growth centres and conurbations, and is therefore frequently located in residential markets that have been affected by increasing tension in recent years. In North Rhine-Westphalia, for instance, over 50 percent of all privately offered apartments are located in the ten most populous municipalities. The spectrum of private-sector companies ranges from highly professionalised public limited companies to small private companies with company-owned apartments and investment funds. Private-sector housing companies generally pursue economic objectives, however they also contribute to the provision of housing for low-income households through their rent-controlled housing stock. On average, approximately 15 percent of the private housing stock in Germany has a social commitment.
Map description: The census differentiates between municipal housing companies, cooperatives and private housing companies in terms of the type of ownership of buildings. The map shows the respective holdings of the three provider groups (which can be chosen from the drop-down menu) at municipal level.
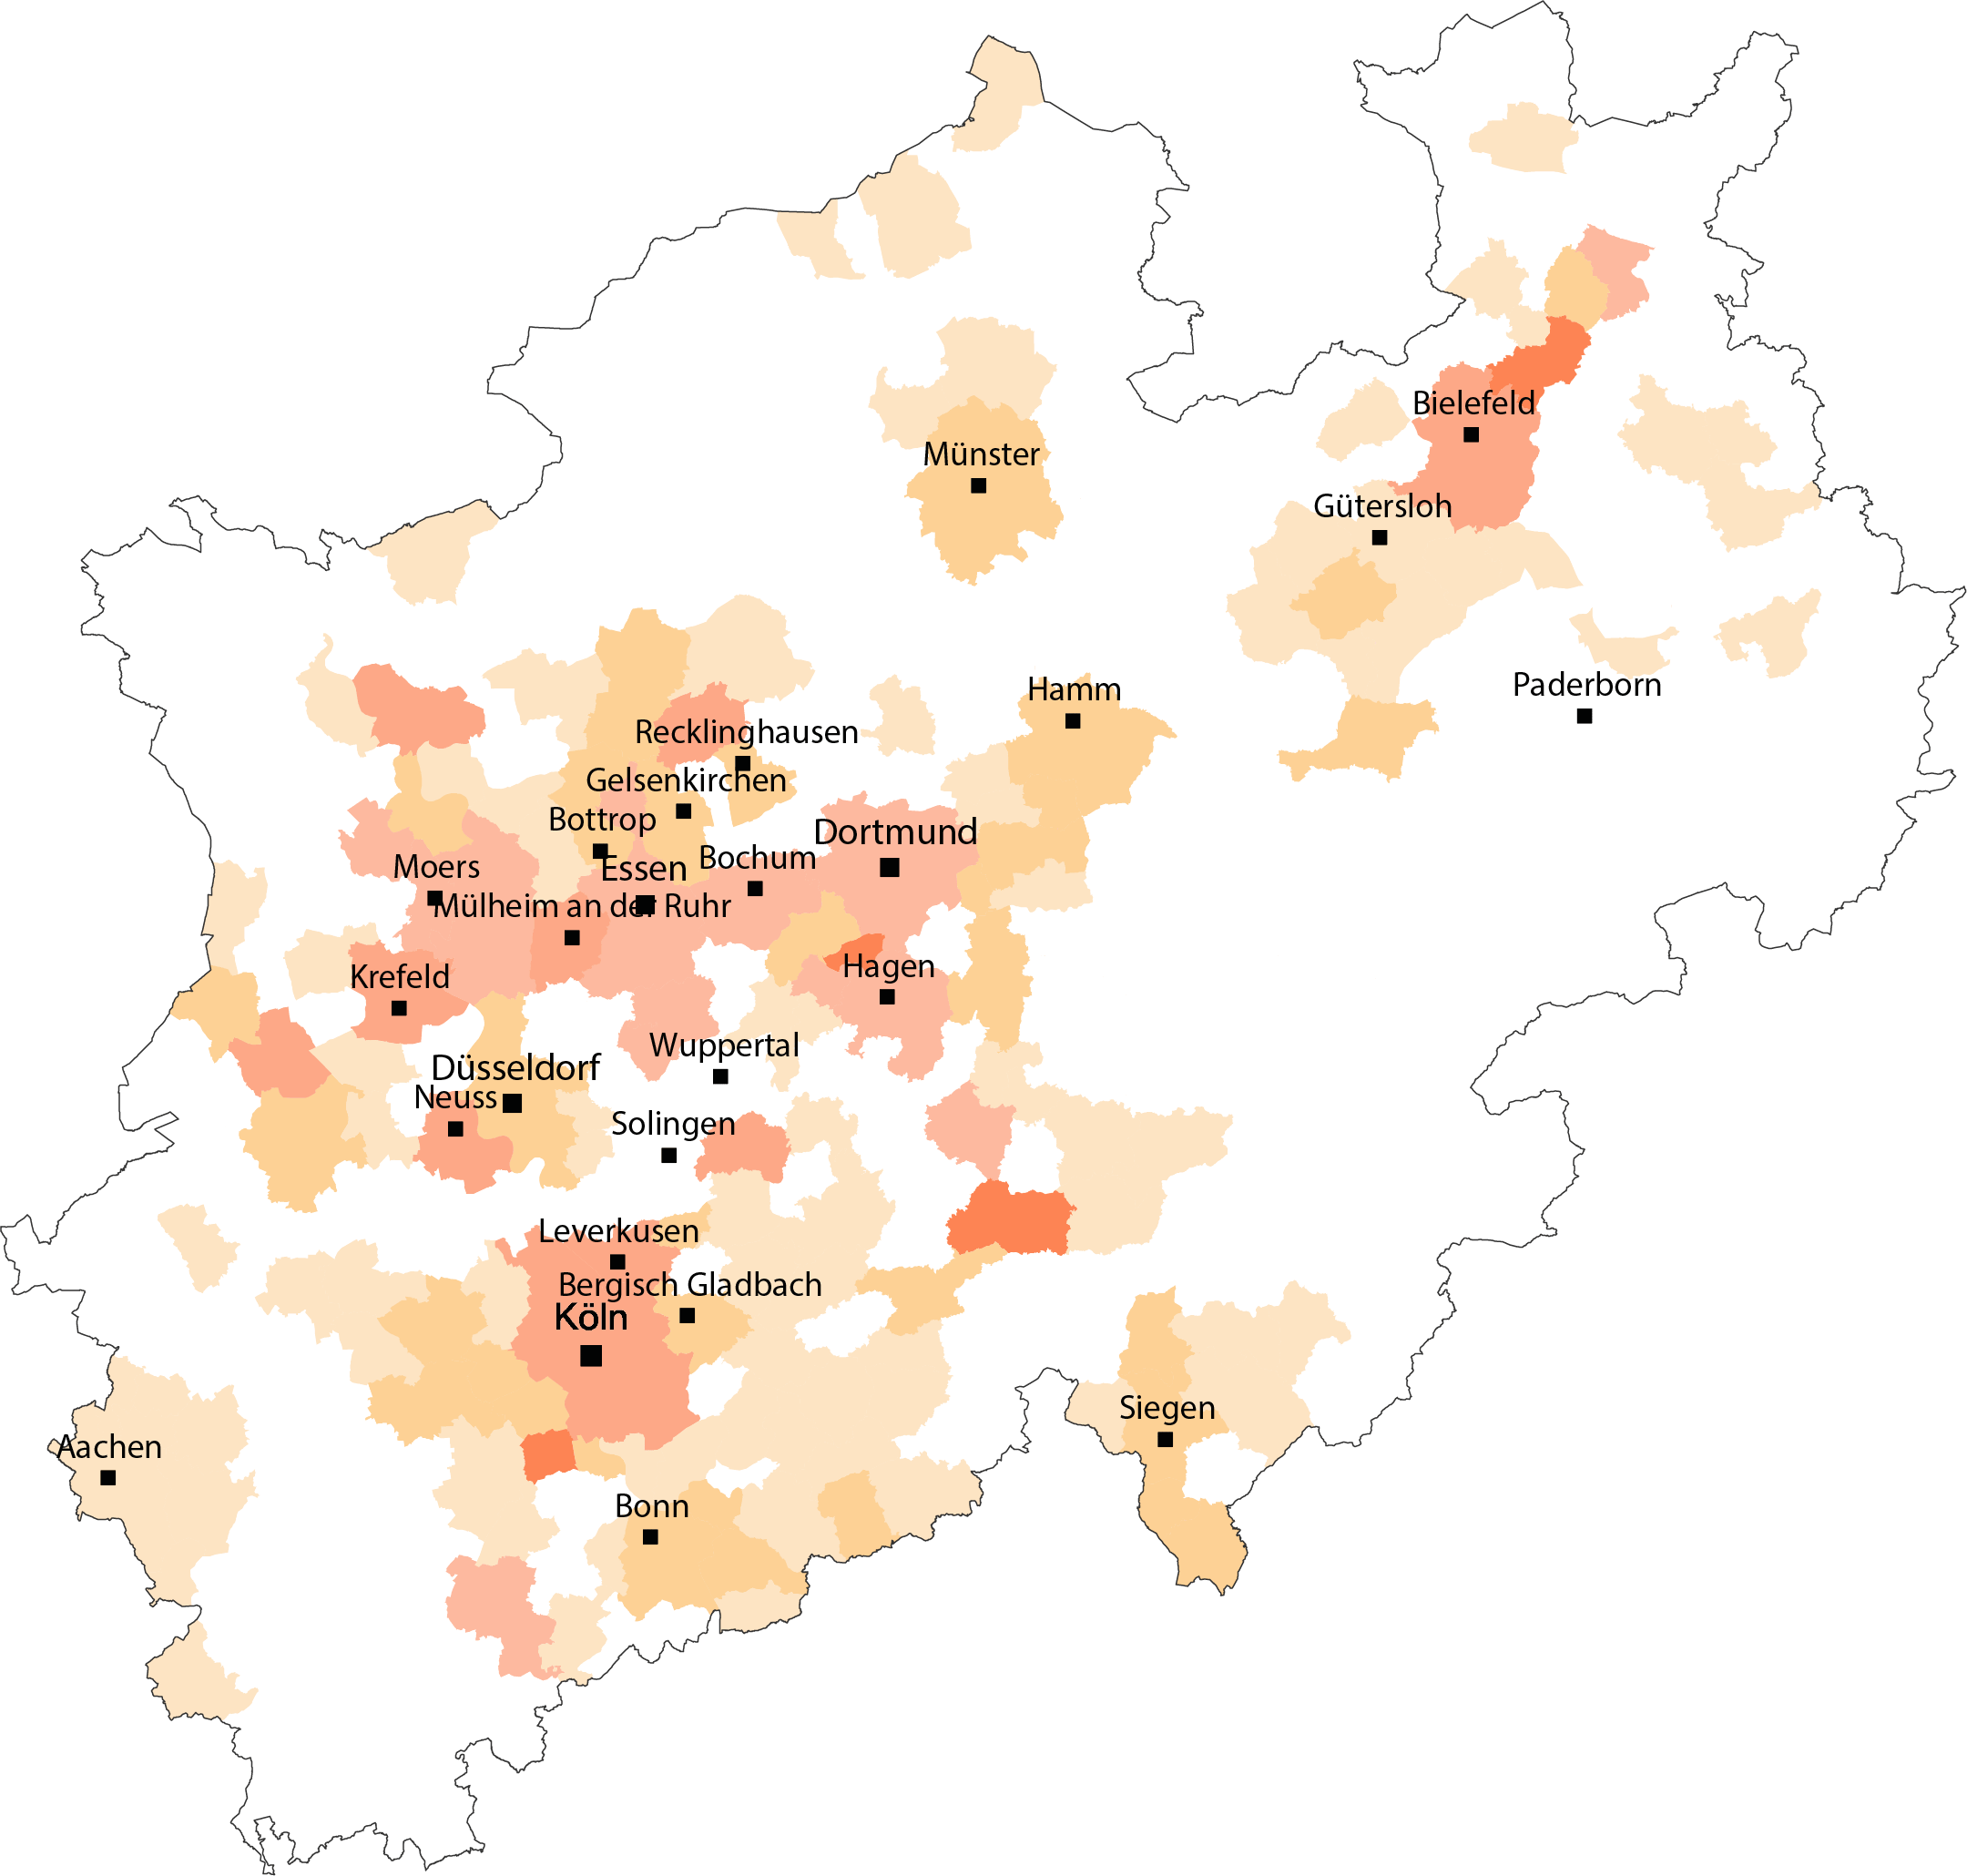
| Municipal housing proportion in % | |
|---|---|
| Meinerzhagen | 15 |
| Herdecke | 14 |
| Herford | 12 |
| Bruehl | 11 |
| Muelheim an der Ruhr | 10 |
| Remscheid | 10 |
| Neuss | 10 |
| Koeln | 10 |
| Marl | 9 |
| Bielefeld | 9 |
Megatrends are the cause and essential element of the transformation of entire regions or cities. Analysing them makes it possible to predict future trends on the basis of sound knowledge, to meet the challenges of a changing world, and thus to plan investments sustainably.